
In late 2025, Senator Sheldon Whitehouse (D-RI) and Congresswoman Suzan DelBene (D-WA-01) reintroduced the Clean Competition Act (“CCA”).[i] First introduced in the 117th Congress on a bicameral basis, the legislation includes two fee-based components: a carbon import fee (“CIF”) on imported goods based on their emissions intensity relative to U.S. producers, and a charge on domestic producers whose emissions intensity fail to meet industry-specific benchmarks. The CIF component puts the CCA among other similar approaches that policymakers are exploring to hold international producers accountable for their emissions and level the playing field for U.S. firms.[ii]
To better understand the revenue implications of this emerging policy set, the Climate Leadership Council developed a “Revenue Estimator” model.[iii] The model mimics the scoring rules and methodologies used by federal revenue-estimating entities like the Congressional Budget Office (“CBO”) and Joint Committee on Taxation (“JCT”) and draws on the most up-to-date, publicly available sources for international trade, country- and sector-level emissions, and industrial output data.[iv]
The Clean Competition Act’s Carbon Import Fee
The CCA would cover a range of emissions-intensive industries, including those that produce fossil fuels, industrial gases and chemicals, fertilizers, metals, cement, glass, and paper. The import charge would be assessed on goods produced across these industries for any emissions above sector-specific emissions intensity benchmarks. Fees would also be phased in on imports of finished goods made from these industrial products; for example, a washing machine may face import charges on the aluminum used to make the inner drum.[v]
Revenue Estimates
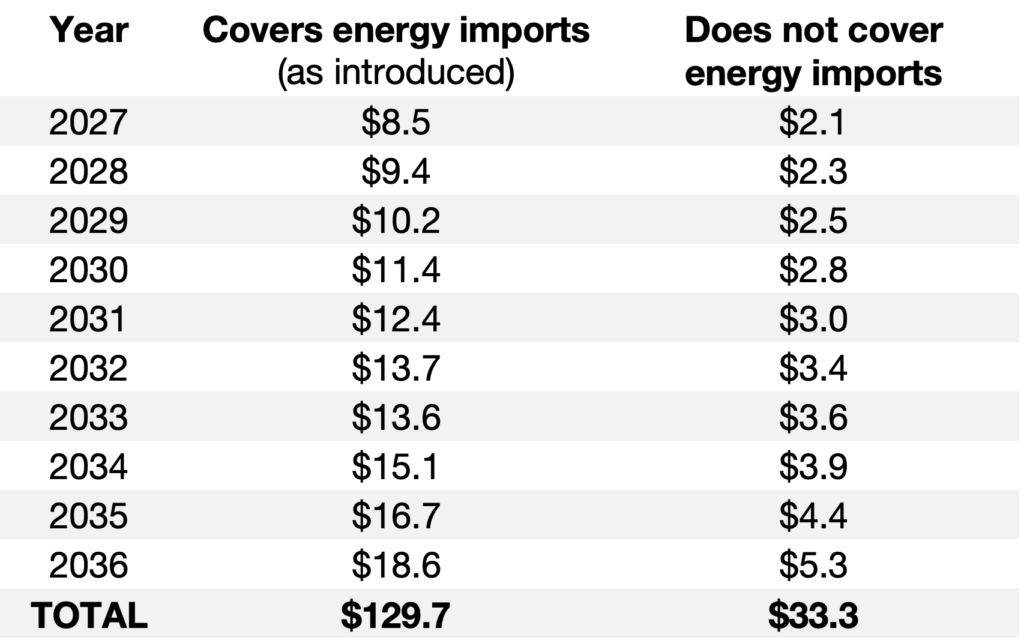
Research suggests that U.S. trading partners emit significantly higher levels of emissions than domestic manufacturers to create the same products.[vi] The CCA’s CIF would generate new revenues from the import of goods that are relatively more emissions-intensive than U.S. competitors. The Council created annual revenue estimates for two different approaches, captured in Table 1.
The first estimate assesses the revenue implications of the CIF as introduced, applying the CIF to products from all listed industrial sectors. The Council’s Revenue Estimator model suggests the CCA as introduced could generate $130 billion over 10 years. As the U.S. emissions intensity benchmarks grows more stringent, annual revenues increase from roughly $9 billion to $19 billion over the scoring window.
The second estimate serves as a check of the Revenue Estimator against other sources of CCA CIF revenue analysis. Peer organizations that developed revenue estimates excluded fossil fuels due to model or data limitations; their analyses suggest 10-year revenues of $28 billion to $40 billion for this narrower CIF.[vii] Excluding fossil fuels from the Revenue Estimator reduces revenue projections to $33 billion over 10 years, within the range of other estimates.
Table 1 – Revenue estimate from CIF component of CCA (nominal $ billions)
[i] “Whitehouse, DelBene Reintroduce Carbon Border Adjustment to Boost Domestic Manufacturers, Tackle Climate Change,” U.S. Senate Committee on Environment and Public Works, December 17, 2025, https://www.epw.senate.gov/public/index.cfm/press-releases-democratic?ID=222BFDA2-A45C-4F29-A42B-2700146B8900
[ii] Other markets are considering similar approaches, including, most notably, the European Union whose Border Carbon Adjustment Mechanism entered its definitive phase on January 1, 2026.
[iii] Scott Nystrom and Catrina Rorke, “The Council’s Revenue Estimator for Pollution Fees,” Climate Leadership Council, March 4, 2025, https://clcouncil.org/report/revenue-estimator/
[iv] The Revenue Estimator draws on 2024 trade data from the U.S. Census Bureau and 2020 data from the OECD that reconciles internationally reported data on country- and sector-level emissions and industrial output. See, “USA Trade Online,” U.S. Census Bureau, https://usatrade.census.gov/; “Greenhouse gas footprint indicators,” OECD, https://www.oecd.org/en/data/datasets/greenhouse-gas-footprint-indicators.html; and “Inter-Country Input-Output tables,” OECD, https://www.oecd.org/en/data/datasets/inter-country-input-output-tables.html
[v] “Clean Competition Act” section-by-section summary released by the U.S. Senate Committee on Environment and Public Works, December 17, 2025, https://www.epw.senate.gov/public/index.cfm/press-releases-democratic?ID=222BFDA2-A45C-4F29-A42B-2700146B8900
[vi] Catrina Rorke, Scott Nystrom, and Daniel Hoenig, “America’s Carbon Advantage,” Climate Leadership Council, March 18, 2025, https://clcouncil.org/report/americas-carbon-advantage-2025/
[vii] Peer analysis includes two studies from Resources for the Future and a team of researchers led by Kyle Meng at the University of California, Santa Barbara. Both studies employed a dynamic approach (rather than the Council’s static approach); excluded fossil fuels; and pulled emissions, trade, and output data from different publicly available sources than the Revenue Estimator. See, Kevin Rennert, Mun Ho, Katarina Nehrkorn, and Milan Elkerbout, “Projected Effects of the Clean Competition Act of 2025,” Resources for the Future, December 17, 2025, https://www.rff.org/publications/reports/projected-effects-of-the-clean-competition-act-of-2025/ and Kyle C. Meng, Gregory Casey, and Ivan Rudik, “The 2025 U.S. Clean Competition Act: Economic and Climate Impacts,” Environmental Markets Lab, January 2026, https://emlab.ucsb.edu/sites/default/files/documents/meng-cca-brief-appendix.pdf