
Springtime has many traditions. Groundhogs look for their shadows, rabbits inexplicably hide eggs from children, an attempt is made to clean out the garage, and—for us energy and analytics nerds—a major update to the Annual Energy Outlook (“AEO”)[i] from the U.S. Energy Information Administration (“EIA”) is released.[ii] However, EIA skipped a release in 2024 to make changes and improvements to its model.[iii] With the 2025 update out today, we thought we would share what we’re looking for in the latest version.
With a few exceptions, the “old” model has underestimated the mid-term potential for lower-carbon energy production in the U.S. and overestimated the mid-term potential for higher-carbon energy production. These modeling limitations to the AEO forecast are due in part to underappreciating of the trend driving U.S. energy production and instability in U.S. energy policy. We unpack these factors with three important examples: U.S. gas production, power generation from wind and solar, and power from coal-fired plants.
Natural Gas Production
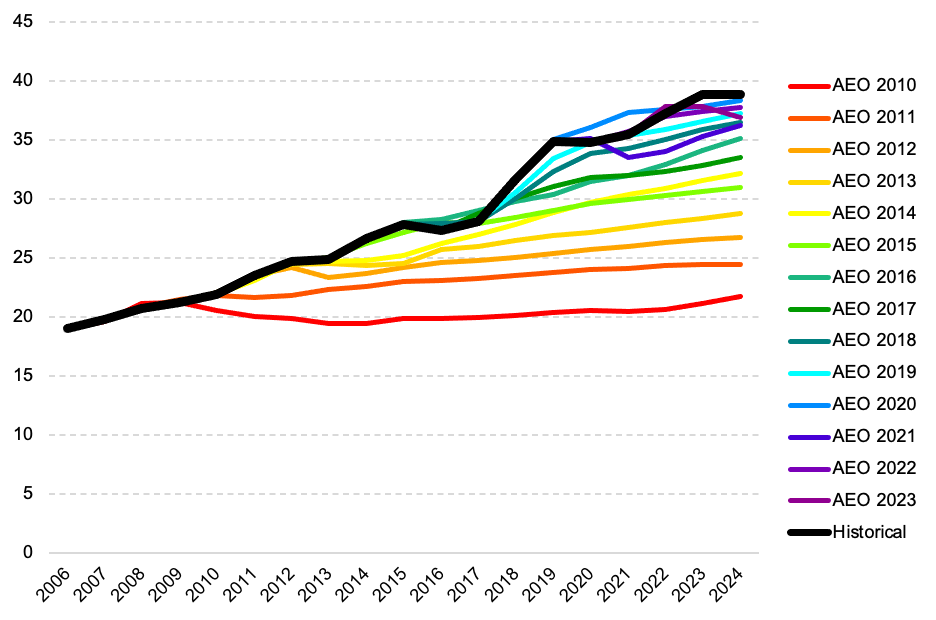
Figure 1 shows perhaps the largest miss in successive AEO forecasts and the most significant change in the U.S. energy sector over the past 20 years: the surge in domestic gas production. Despite projections of long-term stability or decreasing production, U.S. dry gas production doubled between 2006 (19.0 quads)[iv] and 2024 (38.8 quads, up 104%). The AEO regularly underestimated gas production save for small, temporary underestimations in 2015 and 2016 (associated with the global crash in petroleum prices[v] and correlated gas production within certain plays[vi]) and 2020 through 2021 (the COVID pandemic).
Figure 1 – U.S. dry gas production (quadrillion Btu)[vii]
This surge in U.S. natural gas production had several knock-on effects:
- Natural gas prices fell 83% from $12.91 per MMBtu in 2008 to $2.19 in 2024 (using the Henry Hub price and converting to 2024 dollars);[viii]
- Gas-fired power plants usually “set the price” of generation,[ix] therefore lower gas fuel costs put downward pressure on power prices for utility customers;
- U.S. industry had more abundant and affordable gas available as feedstock;[x] and
- The U.S. nearly eliminated liquified natural gas (“LNG”) imports[xi] and started to export LNG to the global market.[xii]
Renewable Power Generation
The forecasted level of wind and solar generation shows another limitation of the AEO and its modeling. Figure 2 shows forecasted and historical U.S. power generation by wind and solar across successive AEO forecasts. There are two notable deviations:
- Between AEO 2010 and AEO 2015, projected wind and solar output would always “flatline;” and
- AEO 2020 through AEO 2023 flipped the trend by overestimating wind and solar deployment levels.
Figure 2 – U.S. solar and wind power generation (terawatt-hours)[xiii]
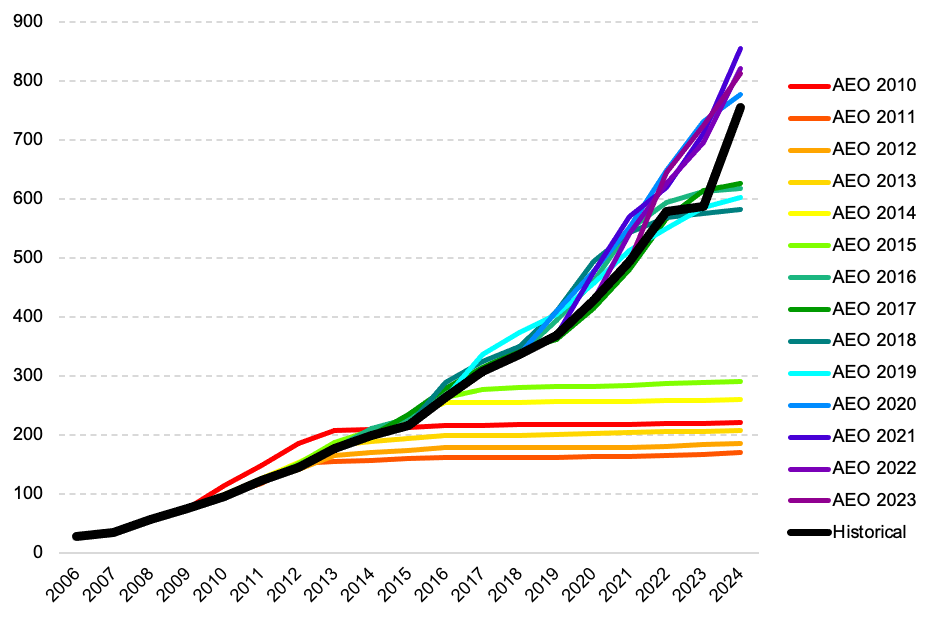
The “flatlining” of renewable generation in AEO releases through 2015 shows the limitation of EIA following input assumptions framed around “current law.”
During the mid-2010s, tax credits for developing solar and wind projects were typically set to expire in the next year or two before Congress repeatedly passed legislation to postpone the sunsetting of solar- and wind-related credits for a few more years.[xiv] Without the credits, the model found adding renewable capacity to be uneconomic and thus renewable output was projected as essentially remaining constant in all future years.
Seeing how the model treats “current law” as opposed to the precedents behind any “current policy” scenario will provide interesting insights within the results.
The snap to overestimating wind and solar generation in the AEO releases between 2020 and 2023 shows two things. The first is the impact of an impossible-to-predict pandemic delaying production and installation of energy infrastructure. The second is the influence of regional interconnection queues. Across the country, new generating assets must go through impact studies to estimate the cost of adding commensurate transmission infrastructure. By the end of 2023, 2.6 terawatts of new capacity were stuck in the interconnection queue—and 95% of the capacity locked behind these transmission constraints were wind or solar.[xv]
The combination of underestimating dry gas production and missing key trends with wind and solar energy means the AEO forecasts also missed trends in greenhouse gas emissions. From 2005 to 2022, the U.S. saw a 39% decrease in carbon dioxide emissions per megawatt-hour of power generation;[xvi] the AEO forecast poorly equipped the public and policymakers to see these trends and integrate them into their policy deliberations.
Coal-Fired Power Generation
Perhaps unsurprisingly, the AEO forecasts underestimating U.S. gas production and output from wind and solar plants was concurrent with an overestimation of the power generated by coal-fired plants. Figure 3 shows how successive AEO forecasts projected power generation from coal to remain roughly stable even as actual coal-fired generation decreased most years because of plant closures and reduced coal dispatch on markets.
Figure 3 – U.S. coal-fired power generation (terawatt-hours)
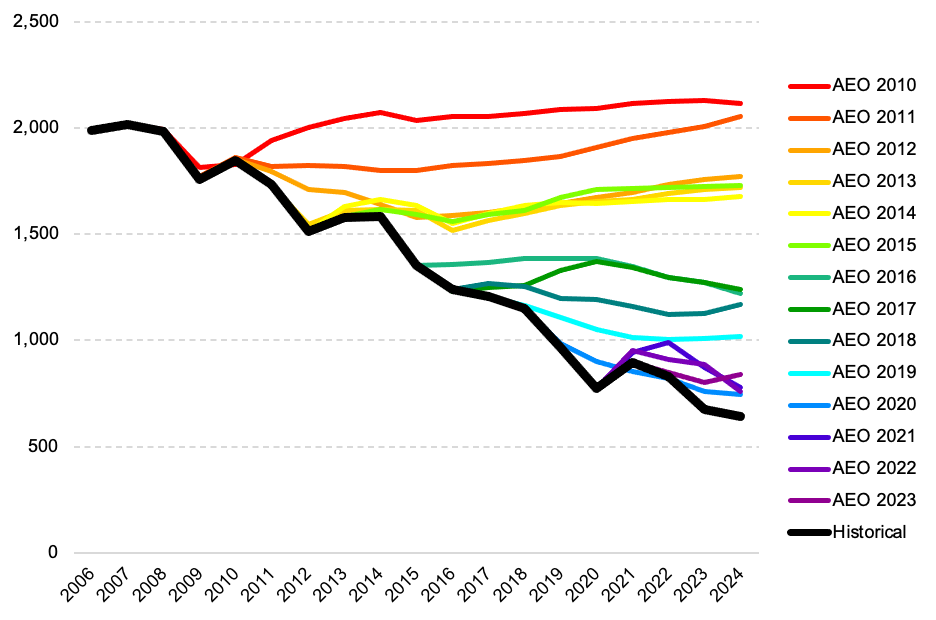
Coal generation decreased 68% from 2006 to 2024 (1,991 TWh to 644 TWh). The moderate increase in 2021 and 2022 shows the short-term supply disruptions related to COVID and the Russian invasion of Ukraine on U.S. and global gas markets. Coal plants became temporarily more competitive when gas prices were temporarily higher.[xvii]
In separate analyses, we have explored the contribution of coal-to-gas switching on U.S. emissions[xviii] and the U.S. industrial pollution advantage.[xix]
Final Thoughts
We understand developing a comprehensive model of the U.S. economy and U.S. energy system is hard. The expanding role of the electric power sector, the gradual shift away from “firm” thermal dispatch to variable renewables dominating the market, and the potential for advanced technologies (e.g., hydrogen, small modular reactors, etc.) and integrating in the critical minerals supply chain only make the task more difficult in 2025.
However, understanding the blind spots in the AEO is important because energy systems analysts (e.g., academics, consultants, investors, regulators, utility planners, etc.) integrate AEO data into their models to calibrate their expectations. Market participants and policymakers in Washington make decisions based on these expectations.
When the AEO forecast misses on the magnitude or direction of the fundamental trends in the energy sector, it has real-world consequences on the future of U.S. power markets, industrial growth, and the development of the U.S. economy relying on them.
We will be watching with great interest how the EIA has updated its model.
[i] “Annual Energy Outlook 2023,” U.S. Energy Information Administration, March 16, 2023, https://www.eia.gov/outlooks/aeo/.
[ii] “Today in Energy,” U.S. Energy Information Administration, April 10, 2025, https://www.eia.gov/.
[iii] “Statement on the Annual Energy Outlook and EIA’s plan to enhance long-term modeling capabilities,” U.S. Energy Information Administration, July 26, 2023, https://www.eia.gov/pressroom/releases/press537.php.
[iv] One quadrillion British thermal units (“Btus”)
[v] “Cushing, OK WTI Spot Price FOB,” U.S. Energy Information Administration, April 11, 2025, https://www.eia.gov/dnav/pet/hist/LeafHandler.ashx?n=pet&s=rwtc&f=a.
[vi] “Gas Constraints Could Limit Bakken Oil Growth,” East Daley Analytics, May 17, 2023, https://www.eastdaley.com/media-and-news/gas-constraints-could-limit-bakken-oil-growth.
[vii] “Natural Gas Gross Withdrawals and Production,” U.S. Energy Information Administration, April 11, 2025, https://www.eia.gov/dnav/ng/ng_prod_sum_a_epg0_fpd_mmcf_a.htm.
[viii] “Henry Hub Natural Gas Spot Price,” U.S. Energy Information Administration, April 11, 2025, https://www.eia.gov/dnav/ng/hist/rngwhhdA.htm.
[ix] “U.S. wholesale electricity prices were lower and less volatile in 2024,” U.S. Energy Information Administration, January 16, 2025, https://www.eia.gov/todayinenergy/detail.php?id=64284.
[x] “U.S. Natural Gas Industrial Consumption,” U.S. Energy Information Administration, April 11, 2025, https://www.eia.gov/dnav/ng/hist/n3035us2a.htm.
[xi] “U.S. Liquified Natural Gas Imports,” U.S. Energy Information Administration, April 11, 2025, https://www.eia.gov/dnav/ng/hist/n9103us2m.htm.
[xii] “Liquified U.S. Natural Gas Exports,” U.S. Energy Information Administration, April 11, 2025, https://www.eia.gov/dnav/ng/hist/n9133us2A.htm.
[xiii] “TWh,” the same unit as one million megawatt-hours
[xiv] Brian Lips, “The Past, Present, and Future of Federal Tax Credits for Renewable Energy,” NC Clean Energy Technology Center, November 19, 2024, https://nccleantech.ncsu.edu/2024/11/19/the-past-present-and-future-of-federal-tax-credits-for-renewable-energy/.
[xv] Joseph Rand, et. al., “Queued Up: Characteristics of Power Plants Seeking Transmission Interconnection,” Lawrence Berkeley National Laboratory, April 2024, https://emp.lbl.gov/sites/default/files/2024-04/Queued%20Up%202024%20Edition_R2.pdf.
[xvi] Scott Nystrom, “Emissions were supposed to increase – here’s why they went down,” Climate Leadership Council, January 9, 2025, https://clcouncil.org/blog/emissions-went-down/.
[xvii] “Price of Liquified U.S. Natural Gas Exports,” U.S. Energy Information Administration, April 11, 2025, https://www.eia.gov/dnav/ng/hist/n9133us3m.htm.
[xviii] Endnote xvii
[xix] Scott Nystrom, “Why is U.S. industry 3x more carbon efficient than China,” Climate Leadership Council, February 4, 2025, https://clcouncil.org/blog/why-is-u-s-industry-3x-more-carbon-efficient-than-china/.