
We at the Council analyzed the impact of a European Union plan to charge certain carbon-intensive goods for the emissions released during their production. Though the plan is far from finalized and significant questions remain, it appears that carbon-efficient U.S. producers stand to gain under the proposal.
The European proposal known as the carbon border adjustment mechanism, or CBAM, will cover aluminum, ammonia, cement, electricity, fertilizers, hydrogen, iron and steel, organic chemicals, and plastics. Broadly, the CBAM aims to charge these materials and commodities based on the carbon generated during their production.
Imports in the covered sectors will be charged a fee comparable to the cost of emissions permits in the EU’s domestic emissions trading system. The fee will be based on the emissions directly released by a good’s manufacturer during production as well as the emissions associated with generating electricity used by the manufacturer.
The details around measurement procedures, reporting requirements, and verification processes are still being worked out, and the scale of administrative costs to importers remains unclear. In addition, the policy must clear more hurdles before it becomes law; it has been proposed by the European Commission and adopted with changes by the Parliament and is currently in the European trilogue process between the Commission, Parliament, and Council.
Upon the policy’s introduction, the EU will begin to phase out allowances that let some European companies emit for free up to a certain level rather than be required to purchase permits under its emissions trading system. As a result, domestic and foreign producers should bear the same carbon price for their emissions under the new policy.
To illustrate the impact on U.S. producers that export covered goods to the EU and explore how carbon-efficient U.S. manufacturers may stand to benefit, we made some calculations. We looked at the volume of trade captured by the CBAM, the emissions that will be priced, and the costs per ton for covered emissions. For a sense of scale, we compared U.S. exports to the EU with Chinese exports to the EU. China and the U.S. are the two largest sources of imports to the European market and U.S.- and Chinese-made goods are in direct competition for market share.
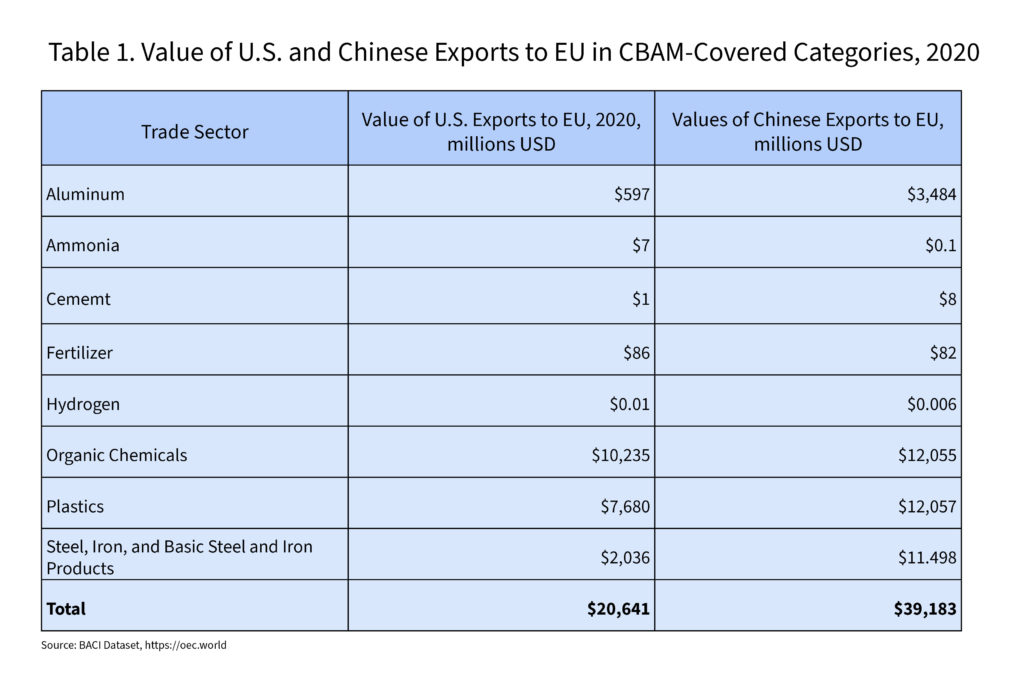
The proposed CBAM is likely to touch only a segment of U.S. exports into EU countries. About $21 billion, or 9%, of the $225 billion in total U.S. exports to the EU in 2020 fell into the categories of materials and commodities directly covered under the proposal. For comparison, China exported nearly double the value of CBAM-covered goods, or $39 billion, out of the $430 billion in total goods China sent to the EU that year. The following table offers a breakdown of these exports for both countries:
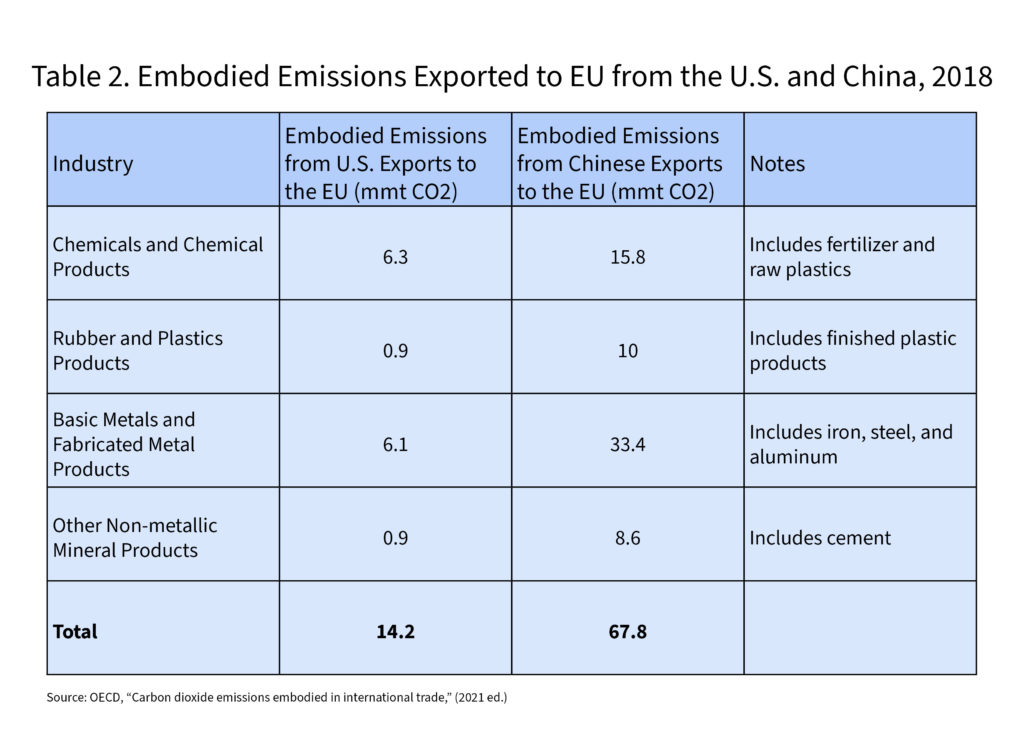
Next, we estimated the carbon emissions embodied in U.S. and Chinese exports to the EU of materials and commodities directly covered under the policy, using Organization for Economic Cooperation and Development data for 2018, the most recent year available.
We know this data to be an overestimate; emissions data from the OECD uses highly aggregated sectoral data, which captures covered goods in categories shared by many goods that the CBAM will not cover. For example, the data bundle together covered goods like plastic or steel with non-covered products like rubber and copper. The data also estimate all emissions generated during manufacture–including emissions associated with the manufacture of other inputs–not just those emissions that will be measured and priced by the CBAM.
As the table below shows, emissions released during the production of goods in sectors that capture CBAM-covered trade totaled around 14.2 million metric tons for the U.S. and 67.8 million metric tons for China.
Charges under the CBAM will be linked to the emissions pricing in the EU’s emissions trading system. Those prices have been in the $85 range and are expected to rise in the near term. Applying an expected CBAM charge of $100/ton of carbon emissions to this upper-bound emissions estimate of 14.2 million metric tons, we arrive at a total charge on all U.S. imports likely to be covered under the policy of $1.4 billion. For Chinese imports, the total charge would be nearly five times higher at $6.8 billion.
The impact on Chinese goods will be much higher than on U.S. goods. China’s CBAM fee is not only many times higher than the U.S. fee, but China also exports about twice as much in potentially covered goods.
Our calculated total CBAM charge, which we know to be a considerable but illustrative overestimate, would be equal to 6.9% of the $21 billion in U.S. exports to the EU captured by the CBAM as currently proposed. For Chinese exports to the EU, we estimate the CBAM charge to be nearly 20% of the $39 billion in traded goods. Compared against total exports to the EU, these estimated CBAM charges would represent only 0.6% of overall U.S.-EU exports while adding up to 1.6% of all Chinese exports to Europe. The overall charges will be distributed unevenly: higher for more carbon-intensive goods within the basket of exports and lower for low-carbon products. This is a broad and imprecise estimate that is useful for painting a picture of the policy’s scale and how it should benefit cleaner firms.
Because U.S. producers emit significantly less carbon to produce American exports than China—and compared to global averages across all of the materials and commodities covered by the CBAM—the charges for U.S. exports to the EU should be much lower than our competitors. In effect, the policy will allow U.S. producers to leverage their carbon advantage and enjoy a competitive advantage against dirtier firms in the EU marketplace, even with a new carbon charge.