Starting in 2026, the EU Carbon Border Adjustment Mechanism (CBAM) will begin charging importers for the emissions associated with the manufacturing of certain products. Producers of iron and steel, aluminum, cement, fertilizers, hydrogen, and electricity around the world will soon have to consider how these additional costs will impact their bottom line.
Previous analysis by the Council shows that 1) the U.S. will pay less in total CBAM fees than most major economies and 2) the U.S. is less reliant on the EU market as a destination for its CBAM-covered exports. This blog introduces a new metric that combines these factors to more precisely assess how countries and sectors will perform under the CBAM regime. The relative CBAM cost burden assesses projected CBAM fees in the context of a country’s global revenue from CBAM-covered exports.
Relative CBAM Cost Burden = Total annual CBAM costs ÷ Total annual value of global exports in CBAM-covered products
By factoring in the value of a country’s global exports, this metric expresses the weight of the CBAM in relative rather than in gross terms (see Figure 1). Let’s take China and India, for example. Both countries are carbon-intensive manufacturers of CBAM-covered products, but they will experience these costs differently. Our calculations show that China will pay 15% more in total CBAM costs than India, in part because China exports 2x more CBAM-covered products to the EU than India. China, however, is a much larger exporting economy than India; China exports 7x more CBAM-covered products globally.
Even though China pays more in total CBAM dues, the relative cost burden metric shows that China is paying a smaller share of its global export revenue under the CBAM than India. China exports just 9% of its iron and steel and 12% of its aluminum to the EU, with most of its shipments destined for other countries in Southeast Asia. Despite its carbon-intensive production, China will experience a relatively low cost burden since the value of Chinese global exports is high relative to its CBAM costs.
India, on the other hand, is set to experience a very high relative cost burden under CBAM due to its carbon-intensive production and high degree of reliance on the EU market. India exports 25% of its iron, steel, and aluminum to the EU market, which means that its CBAM costs will be high compared to the revenue that India generates from its global exports of CBAM-covered goods.
Firms from India and other countries that are exposed to a high relative cost burden will be more likely than competitors to feel the weight of the CBAM price. This increased price pressure will push companies to either decarbonize their operations to remain competitive in the EU market or seek alternative export destinations. Cleaner U.S. firms will have an opportunity to outcompete or replace these foreign competitors in the EU market.
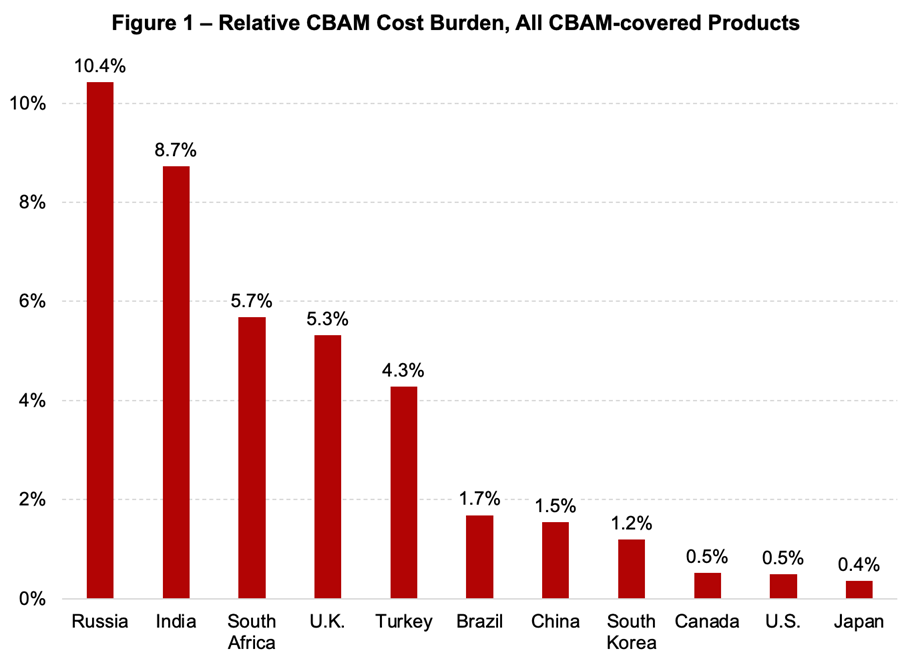
The U.S. relative cost burden under CBAM is 3x less than China and Brazil, 10x less than Turkey, the U.K, and South Africa, and 20x less than India and Russia, who will experience the greatest relative cost burden. These projections are consistent with findings by the Boston Consulting Group and the World Bank.
These results also hold true across covered sectors. Since iron and steel make up the bulk of CBAM-covered exports to the EU for the countries shown in Figure 1, our projections for the iron and steel industry closely mirror our economy-wide estimates (see Figure 2).
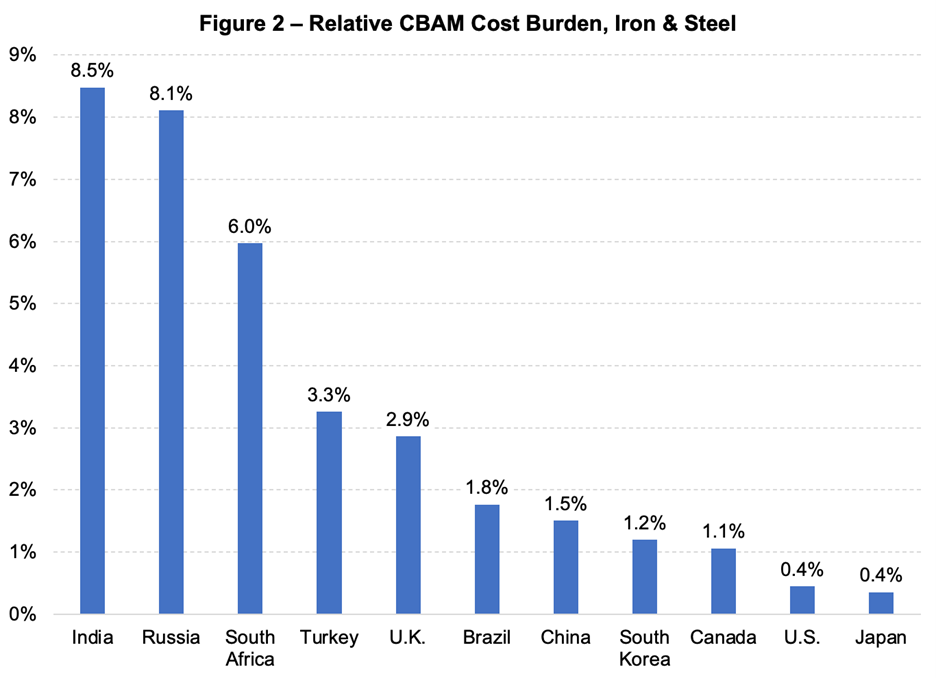
Figure 2 illustrates that relative to other major economies, the U.S. is both more carbon efficient in its iron and steel manufacturing and less reliant on the EU market. Consequently, the relative CBAM cost burden for U.S. iron and steel producers is roughly 3x lower than South Korea, China, and Brazil, 6x lower than the U.K., and 16x lower than Russia and India.
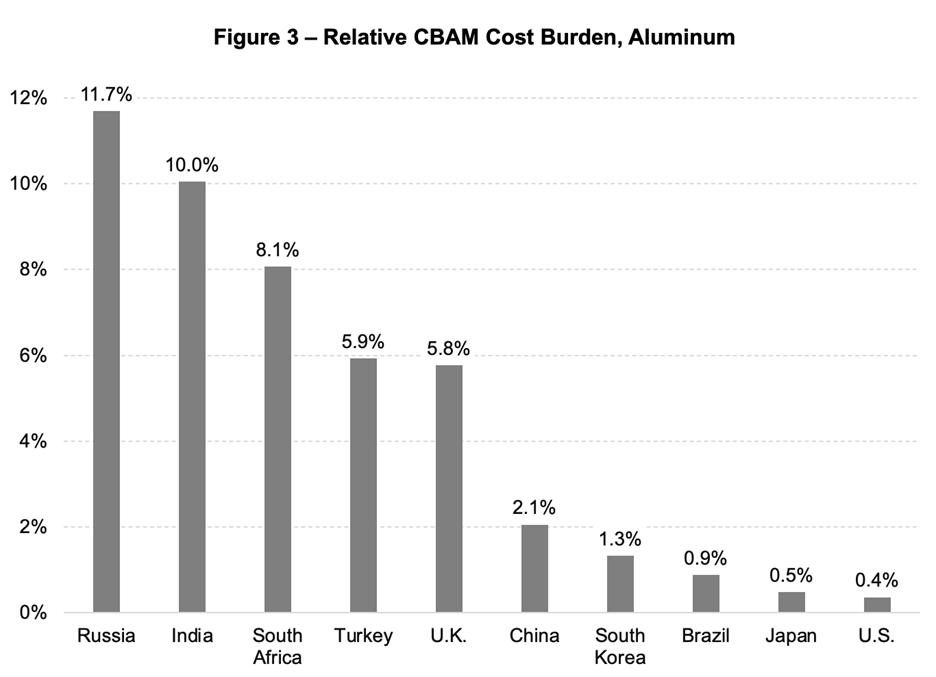
This trend also holds true in the aluminum sector, where the relative CBAM cost burden suggests that U.S producers are less exposed than foreign producers by a degree of 5x for China, 15x for the U.K and Turkey, 20x for South Africa, 25x for India, and 30x for Russia (see Figure 3).
This analysis at both the economy-wide and sector-specific levels confirms once again what we know to be true: when trade mechanisms introduce accountability for the carbon intensity of industrial production, more efficient firms are handed an interesting opportunity.