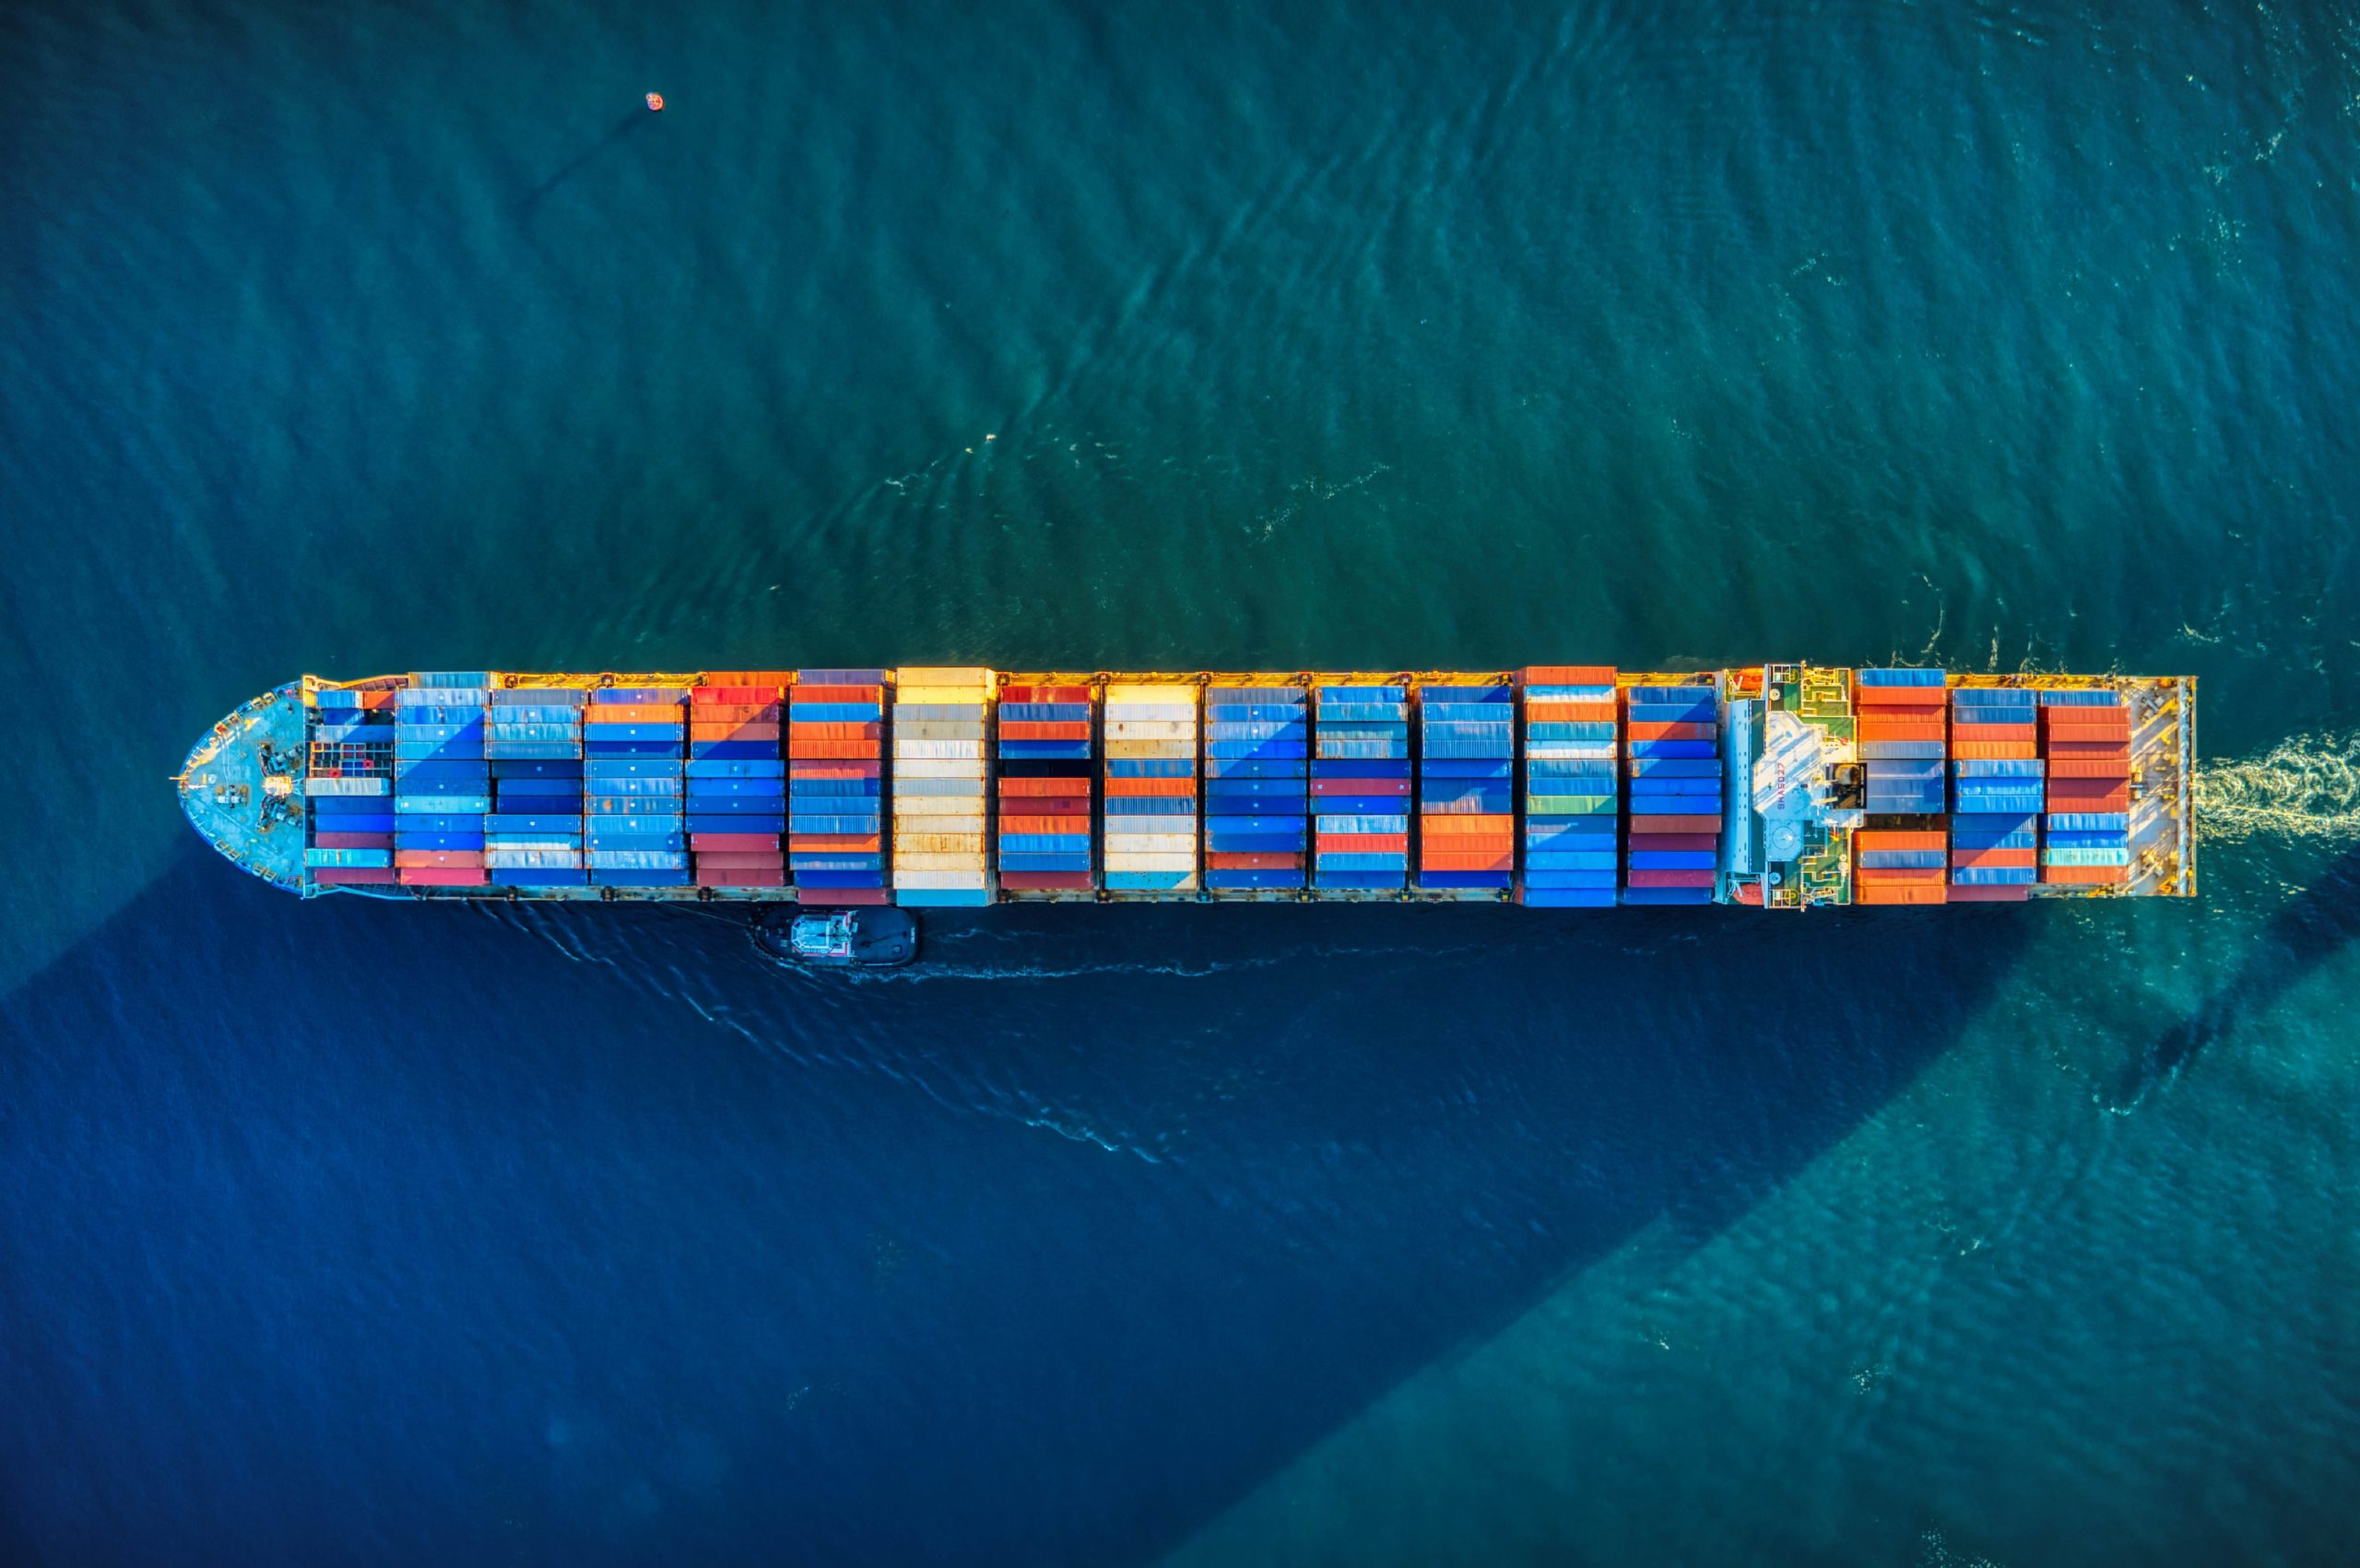
Carbon import fees are gaining traction around the world. This novel policy tool would impose a charge on imported goods…
January 15, 2025
By Daniel Hoenig
The Climate Leadership Council is obsessed with data. Here is one trend we’ve been thinking about lately: Democrats and Republicans,…
January 9, 2025
By Scott Nystrom
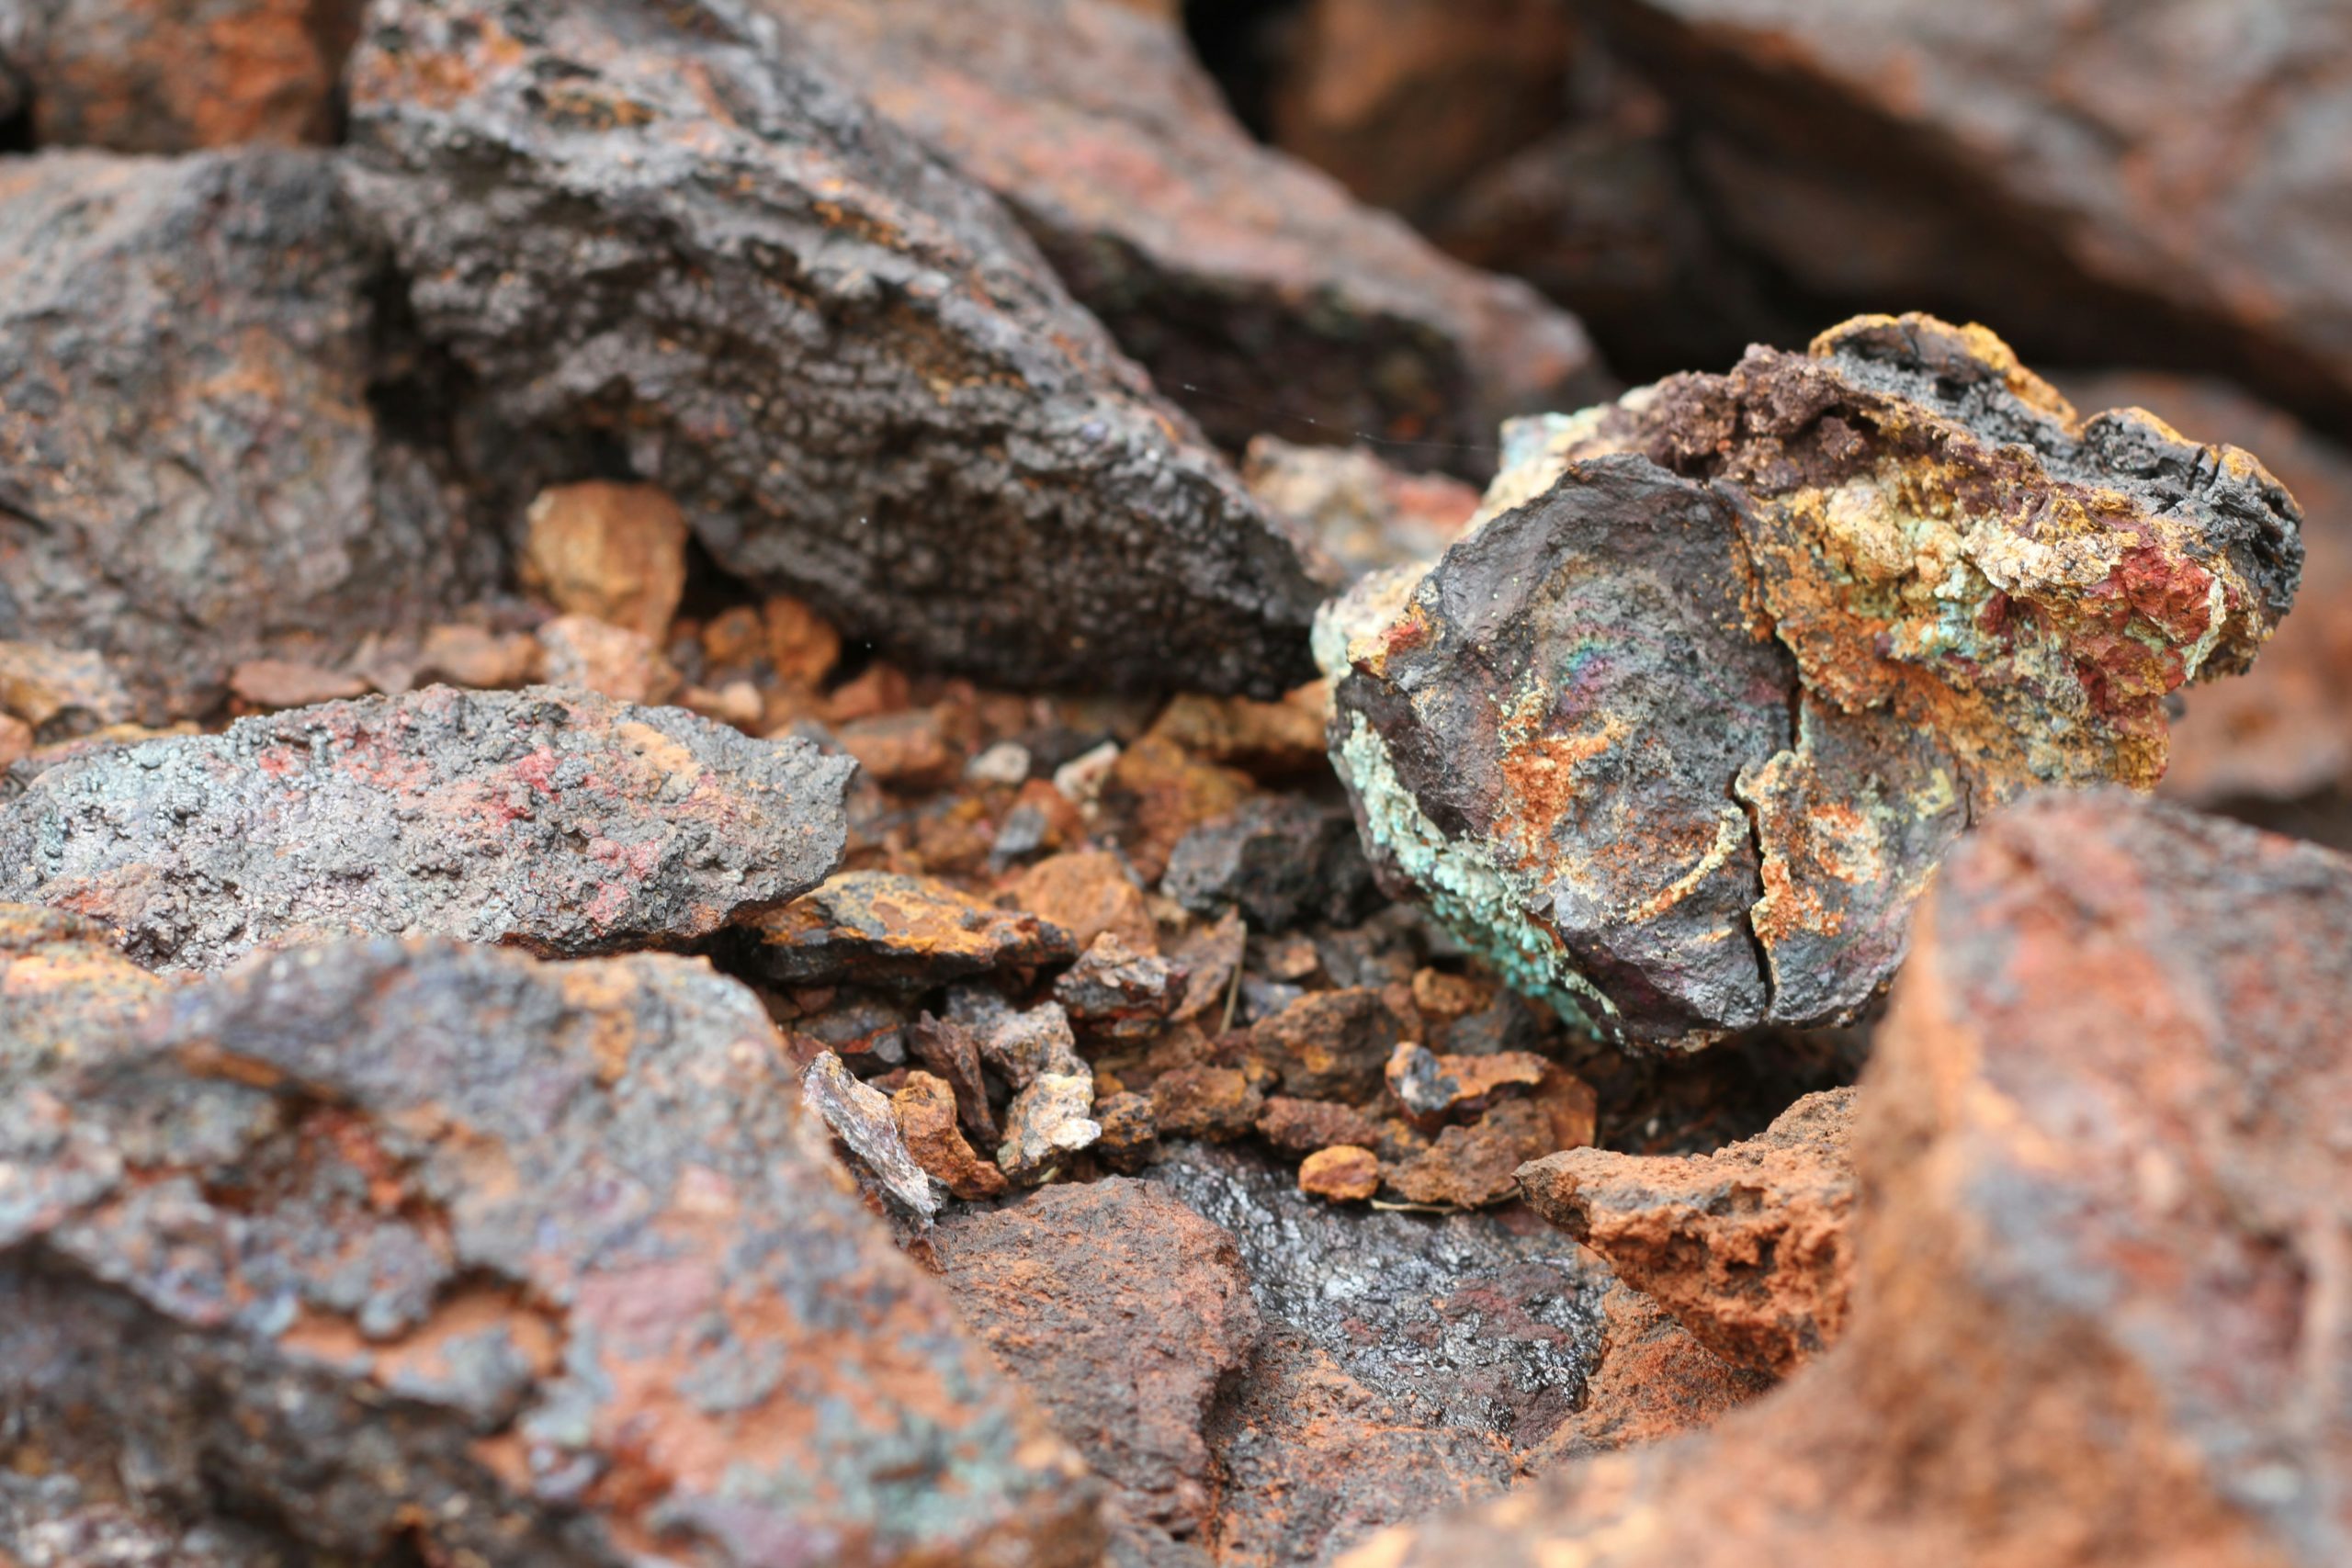
Diverse and reliable critical mineral supply chains are a vital component of any strategy to reduce greenhouse gas emissions. Minerals…
November 12, 2024
By Catrina Rorke
The U.S. built the first nuclear reactor and dramatically outpaced global competitors in innovation and deployment in the earliest days…
July 10, 2025
By Dan Giamo and Daniel Hoenig
In a positive step toward expanding clean energy access, the World Bank lifted its longstanding ban on financing nuclear energy…
July 1, 2025
By Dan Giamo and Mary Svenstrup
The Council’s America’s Carbon Advantage 2025 report analyzes the foundation of the U.S. carbon advantage. The three factors driving the…
June 27, 2025
By Catrina Rorke, Scott Nystrom, and Daniel Hoenig
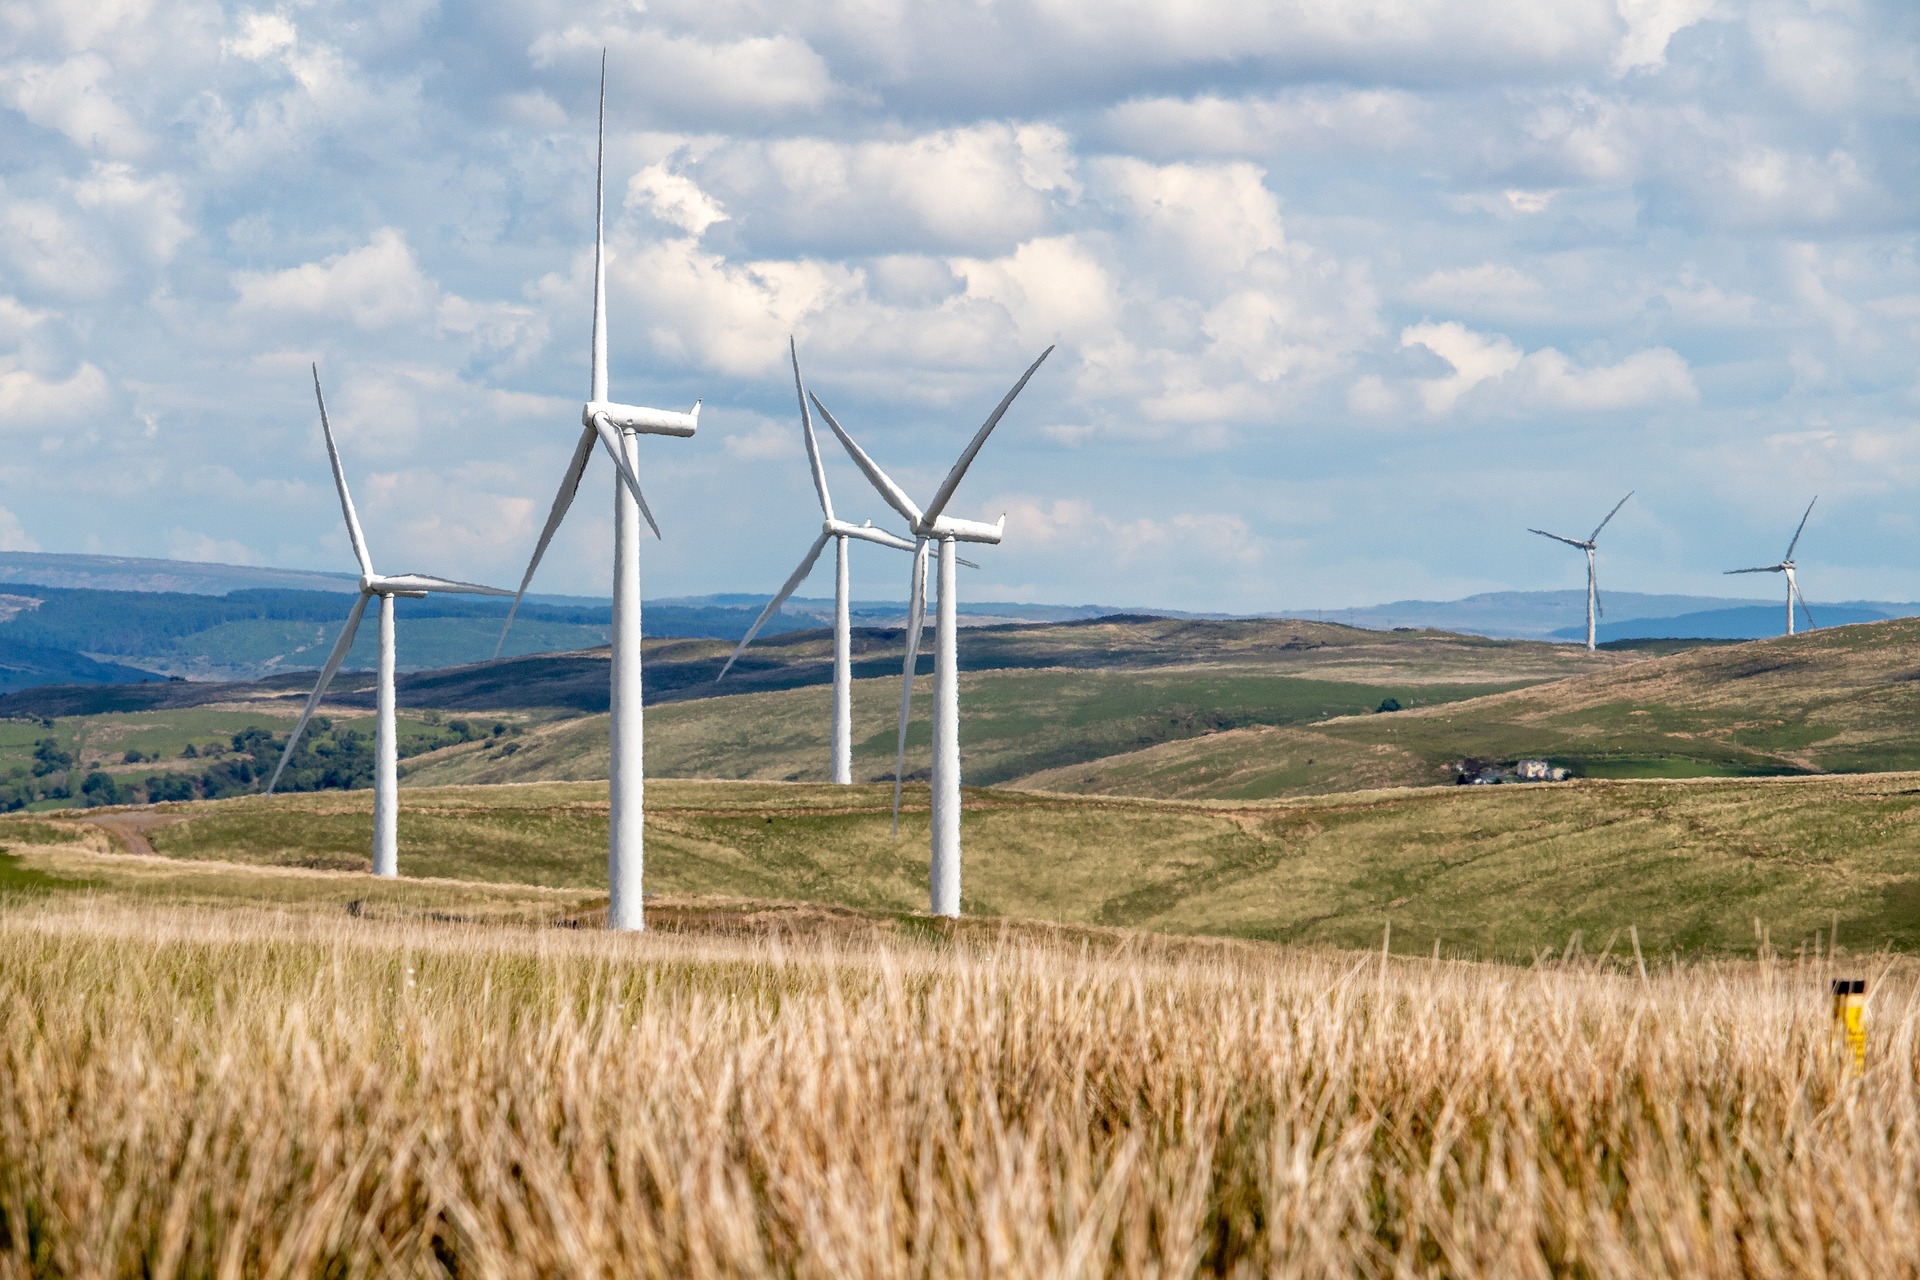
The Council’s research in Prioritizing American Interests articulated a $130 trillion global market opportunity for clean energy technologies through 2050.…
May 29, 2025
By Dan Giamo
Critical minerals supply chain security is drawing significant policymaker interest, with three executive orders and at least seven bills introduced…
May 27, 2025
By Holly Rooper
The Climate Leadership Council submitted public comments to the Department of Commerce’s Section 232 investigation on processed critical mineral imports,…
May 21, 2025
By Catrina Rorke
Beginning in January 2026, certain exports to the European Union—including steel and aluminum—will face charges under the EU’s Carbon Border…
April 30, 2025
By Matthew C. Porterfield and Daniel Hoenig
Policymakers are increasingly interested in understanding the complex, nuanced supply chains for critical minerals and in improving supply chain security.…
April 30, 2025
By Holly Rooper
Springtime has many traditions. Groundhogs look for their shadows, rabbits inexplicably hide eggs from children, an attempt is made to…
April 15, 2025
By Scott Nystrom
Policymakers across the government are working to re-think and improve the U.S.’s foreign assistance and investment toolkit, including the Development…
April 15, 2025
By Catrina Rorke
In the complex landscape of international trade and climate policy, the question of carbon efficiency—how much carbon dioxide is emitted…
April 14, 2025
By Catrina Rorke, Scott Nystrom, and Daniel Hoenig
The United States holds a significant carbon efficiency advantage, meaning American firms generally produce similar goods with fewer emissions than…
March 18, 2025
By Catrina Rorke, Scott Nystrom, and Daniel Hoenig
Last week, the U.S. International Trade Commission (ITC) released a report assessing the greenhouse gas (GHG) emissions intensities of steel…
March 5, 2025
By Daniel Hoenig
Policymakers in Washington are considering charging a foreign pollution fee or pollution tariff on imports determined by the pollution caused…
March 4, 2025
By Scott Nystrom and Catrina Rorke
In this letter to President Trump, Senior Vice President of Policy and Research Catrina Rorke outlines recommendations that are designed…
February 27, 2025
By Catrina Rorke
Supply chain security has emerged as a defining priority among federal policymakers, with a particular focus on critical minerals. President…
February 21, 2025
By Dan Giamo and Holly Rooper
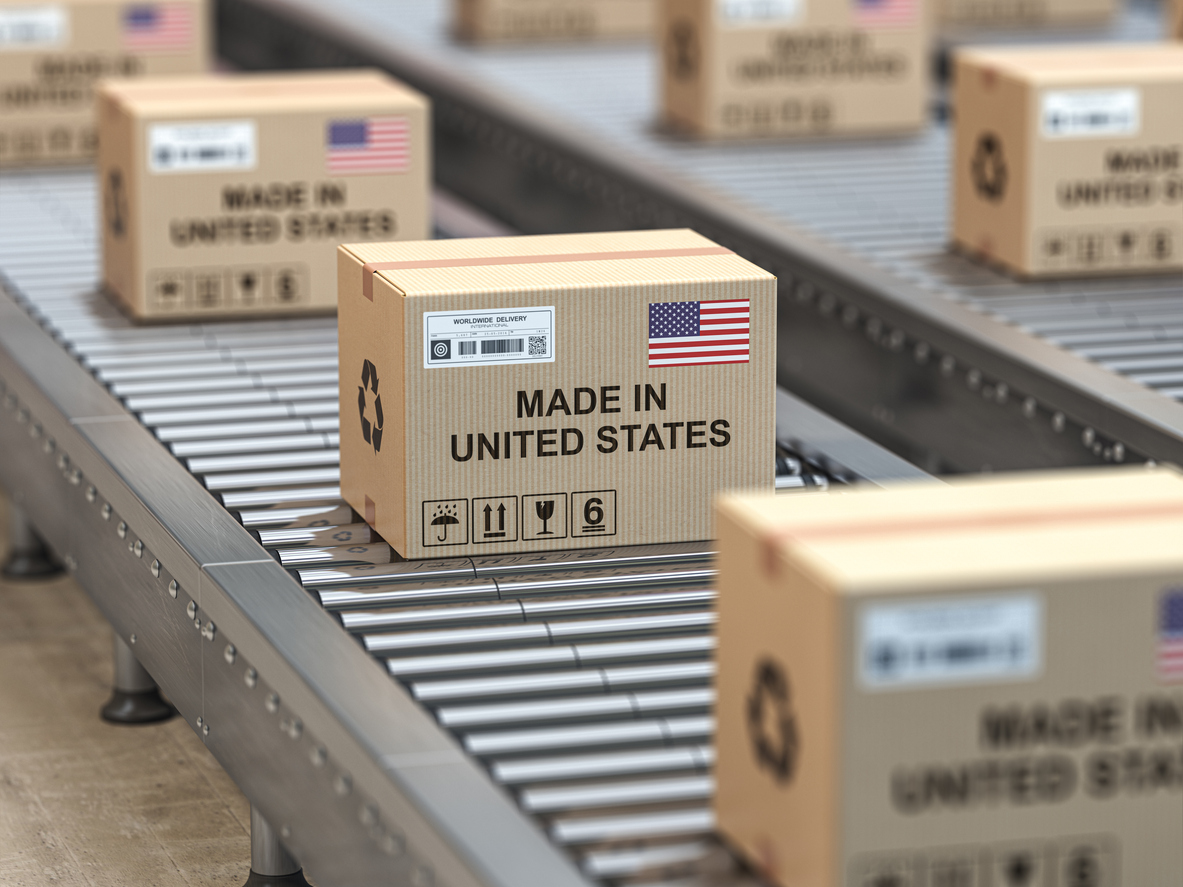
The U.S. is the second-largest global manufacturer after China. However, the energy inputs these two countries use to fuel industry…
February 4, 2025
By Scott Nystrom
Carbon import fees are gaining traction around the world. This novel policy tool would impose a charge on imported goods…
January 15, 2025
By Daniel Hoenig
The Climate Leadership Council is obsessed with data. Here is one trend we’ve been thinking about lately: Democrats and Republicans,…
January 9, 2025
By Scott Nystrom
Diverse and reliable critical mineral supply chains are a vital component of any strategy to reduce greenhouse gas emissions. Minerals…
November 12, 2024
By Catrina Rorke
The U.S. built the first nuclear reactor and dramatically outpaced global competitors in innovation and deployment in the earliest days…
July 10, 2025
By Dan Giamo and Daniel Hoenig
In a positive step toward expanding clean energy access, the World Bank lifted its longstanding ban on financing nuclear energy…
July 1, 2025
By Dan Giamo and Mary Svenstrup
The Council’s America’s Carbon Advantage 2025 report analyzes the foundation of the U.S. carbon advantage. The three factors driving the…
June 27, 2025
By Catrina Rorke, Scott Nystrom, and Daniel Hoenig
The Council’s research in Prioritizing American Interests articulated a $130 trillion global market opportunity for clean energy technologies through 2050.…
May 29, 2025
By Dan Giamo
Critical minerals supply chain security is drawing significant policymaker interest, with three executive orders and at least seven bills introduced…
May 27, 2025
By Holly Rooper
The Climate Leadership Council submitted public comments to the Department of Commerce’s Section 232 investigation on processed critical mineral imports,…
May 21, 2025
By Catrina Rorke
Beginning in January 2026, certain exports to the European Union—including steel and aluminum—will face charges under the EU’s Carbon Border…
April 30, 2025
By Matthew C. Porterfield and Daniel Hoenig
Policymakers are increasingly interested in understanding the complex, nuanced supply chains for critical minerals and in improving supply chain security.…
April 30, 2025
By Holly Rooper
Springtime has many traditions. Groundhogs look for their shadows, rabbits inexplicably hide eggs from children, an attempt is made to…
April 15, 2025
By Scott Nystrom
Policymakers across the government are working to re-think and improve the U.S.’s foreign assistance and investment toolkit, including the Development…
April 15, 2025
By Catrina Rorke
In the complex landscape of international trade and climate policy, the question of carbon efficiency—how much carbon dioxide is emitted…
April 14, 2025
By Catrina Rorke, Scott Nystrom, and Daniel Hoenig
The United States holds a significant carbon efficiency advantage, meaning American firms generally produce similar goods with fewer emissions than…
March 18, 2025
By Catrina Rorke, Scott Nystrom, and Daniel Hoenig
Last week, the U.S. International Trade Commission (ITC) released a report assessing the greenhouse gas (GHG) emissions intensities of steel…
March 5, 2025
By Daniel Hoenig
Policymakers in Washington are considering charging a foreign pollution fee or pollution tariff on imports determined by the pollution caused…
March 4, 2025
By Scott Nystrom and Catrina Rorke
In this letter to President Trump, Senior Vice President of Policy and Research Catrina Rorke outlines recommendations that are designed…
February 27, 2025
By Catrina Rorke
Supply chain security has emerged as a defining priority among federal policymakers, with a particular focus on critical minerals. President…
February 21, 2025
By Dan Giamo and Holly Rooper
The U.S. is the second-largest global manufacturer after China. However, the energy inputs these two countries use to fuel industry…
February 4, 2025
By Scott Nystrom
Carbon import fees are gaining traction around the world. This novel policy tool would impose a charge on imported goods…
January 15, 2025
By Daniel Hoenig
The Climate Leadership Council is obsessed with data. Here is one trend we’ve been thinking about lately: Democrats and Republicans,…
January 9, 2025
By Scott Nystrom
Diverse and reliable critical mineral supply chains are a vital component of any strategy to reduce greenhouse gas emissions. Minerals…
November 12, 2024
By Catrina Rorke