
When we tally a country’s carbon emissions, we typically consider only those emissions generated within its borders. But this approach misses an important dynamic in the global economy: while emissions in developed countries are generally holding flat or declining, this progress is undercut by higher emissions from less efficient countries. Yet those higher emissions are often associated with the production of goods that are exported to the developed world.
The export-heavy countries of Brazil, Russia, India, and China—together known as the BRIC countries—are as much as four times more carbon-intensive than the U.S. economy, on average. As the United States and other large, clean economies have leaned more on these emerging markets for basic inputs like fuel or steel, or finished goods like solar panels and clothing, they have pushed up BRIC production—and emissions. As a result, the BRIC countries have accounted for 90% of global emissions growth since 2005.
This raises the question: what would happen if we had market incentives in place in the global economy to encourage more production in less carbon intensive regions, and more competition for greater emission reductions everywhere? What follows are illustrative examples of the scale of emissions reductions that could be targeted through trade policy.
First, let’s consider the magnitude of emissions that are traded globally each year. A quarter of global CO2 emissions are embodied in goods traded internationally, meaning they were generated during the production of these goods, according to a 2018 report by the consultancies KGM & Associates and Global Efficiency Intelligence.
Next, let’s look at the emissions imports of a few major developed economies. In 2018, the U.S., European Union, Japan, United Kingdom, and Canada imported a total of $8.7 trillion worth of goods and services from the world, representing 3.6 billion metric tons of CO2, or roughly 11% of global carbon emissions. Some of these imports were traded among these large, clean economies, but most came from countries with far more carbon-intensive production.
Finally, let’s look at how the carbon intensity of these respective countries’ imports compared with the carbon intensity of the goods they produced at home. As you can see from the chart, there is quite a gap between the two.
Relative Carbon Intensity of Domestic Production and Imports
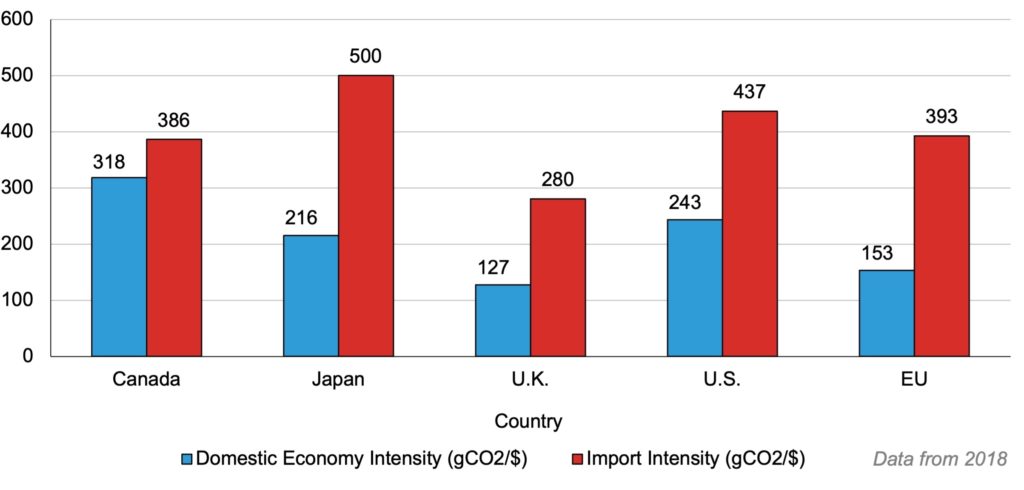
The large disparity between the carbon intensity of domestic production and imports allows us to envision a world where these imports match the lower carbon intensity of the importing country—either by shifting production to the more efficient country or seeing the exporting country lower their carbon intensity.
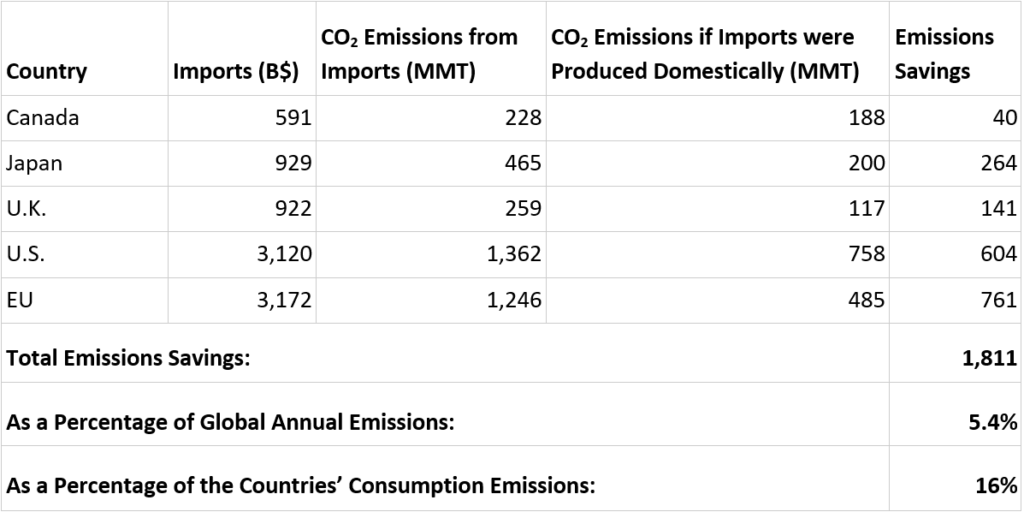
If the imports of these large, cleaner economies had been produced at home—or elsewhere, at similar carbon intensity—annual global emissions would be roughly 5.4%, or 1.8 billion tons of CO2, lower. The impact of these emissions savings on these countries’ total consumption-related emissions is even starker: they would be 16% lower.
Hypothetical Emissions Savings
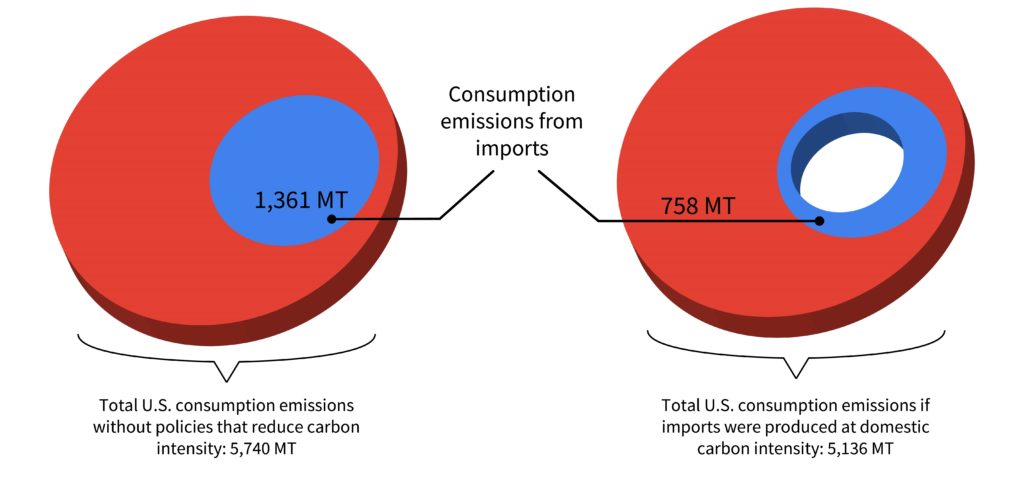
As the chart below shows, reducing the carbon intensity of imported goods would cut U.S. consumption emissions by 603 million tons:
U.S. Consumption and Import Emissions
Exports from Carbon-Intensive Producers
The gap in carbon intensity of production is even more striking when we look at it from the perspective of the world’s largest exporters. The BRIC countries, which together produce $4 trillion in exports to the world, generate far more emissions in their production than the U.S., as the chart below illustrates.
BRIC Export Carbon Intensity
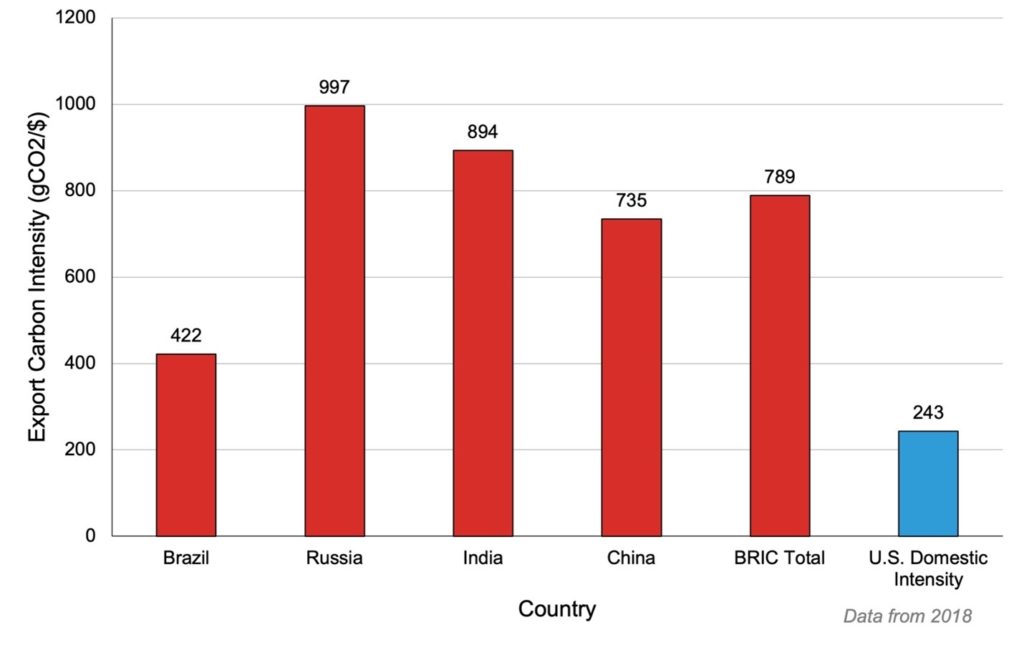
At these high carbon intensities, BRIC exports accounted for 3 billion metric tons of CO2 in 2018. Note that the carbon intensity of these exports is nearly double the carbon intensity of the basket of imports from advanced economies that we examined above.
Let’s look at another illustrative example using these figures. If the U.S. replaced the BRIC countries’ $4 trillion in exports—or if BRIC exports were produced at the same carbon-intensity as U.S. goods—the emissions embodied in those exports would fall from 3 billion to just under 1 billion tons of CO2. This would amount to a 6.2% drop in global emissions.
Unfortunately, the current rules of trade place no value on carbon mitigation. In fact, they can often create a disincentive to invest in lower-emissions production. Some, though not all, investments to lower pollution can raise a firm’s costs, diminishing its competitiveness against firms that avoid such investments. This is a failure of the global market economy.
In the near term, we should be rewarding more carbon-efficient regions and firms by giving them a price advantage over less carbon-efficient regions and firms. Longer term, we should seek global incentives for more carbon-intensive firms to make the necessary investments to catch up to their cleanest competitors. Ultimately, our goal should be a global marketplace that encourages everyone to outcompete their rivals based on carbon efficiency: a race to the bottom. A race to zero emissions.
As climate ambitious economies seek ways to accelerate global decarbonization, they should remember the power and leverage they hold as major customers in the world market. Policies that account for the emissions embodied in traded goods will encourage higher production and more trade among large, low-carbon economies. The more we shift production to technologies and regions with lower carbon-intensity, the more economies of scale and opportunities for innovation we create to benefit the climate.