Addressing global emissions levels will require all countries to work toward lowering their domestic emissions. Many historically high emitters have undertaken major policies to reduce production emissions. The U.S., for example, has increased investments in clean technologies through the Inflation Reduction Act (IRA), Infrastructure Investment and Jobs Act (IIJA), and CHIPS and Science Act. Many other G7 countries are following suit, adopting diverse policy sets to drive their transition to a clean economy.
And yet…
If every advanced economy can completely decarbonize, we’ll still overshoot our global climate goals. As emissions decrease in the Global North, the Global South’s emissions are rapidly increasing. Developing countries contributed 95% of global emissions increases over the last decade and accounted for 75% (44 GT) of global emissions in 2023. Projections demonstrate this trend will likely continue.
Figure 1 describes projected emissions trajectories that show the magnitude of addressing this challenge:
- Scenario 1: Emissions roughly as they are today, based on 2023 levels.
- Scenario 2: Business as usual (“BAU”) reflects the continuation of past trends into 2050.
- Scenario 3: “Achieved goal” shows global emissions in 2050 if all countries were able to instead meet their stated international decarbonization goals under the Paris Agreement.
If countries do not change their emissions trajectories, developing world emissions will rise to 54 GT of carbon dioxide, a 23% increase that will ensure mid-century emissions are higher than they are now.
Figure 1. Visualizing mid-century emissions for three scenarios for Developed and Developing Countries (GT)
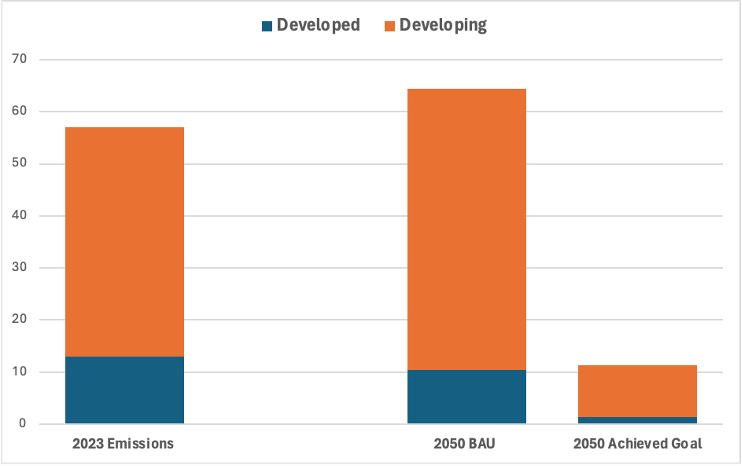
Source: World Emissions Clock
Why is this happening?
Emissions growth in the Global South is driven by rapid industrialization. Over the past two decades, manufacturing has shifted from advanced economies to developing regions. The lower cost of production in these regions creates an inherent competitive advantage, often creating financial rewards for environmentally lax and carbon-intensive production methods. This isn’t a case of “squeezing the balloon,” where the same quantity of emissions simply shift from developed to developing countries. Instead, the difference in where manufacturing takes place is actually increasing the emissions associated with industrial activity.
We can measure the impact of trade on global emissions through the carbon loophole, which refers to the CO2 emissions from goods produced in one country but consumed in another. As manufacturing has shifted toward the Global South, global carbon emissions have increased by 60%, and the carbon loophole has ballooned to 8 GT CO2.
Opportunities for change
Trade tools can help all countries lower their emissions. Some countries are already adopting carbon import fees and similar policies that impose a charge on imports based on the carbon intensity of products, shifting trade flows to favor the most carbon-efficient firms.
The European Union’s Carbon Border Adjustment Mechanism (CBAM) is in its transitional stage, with pricing to be phased in on January 1, 2026. The UK plans to implement a similar mechanism a year later. In Asia, Taiwan is set to implement a carbon levy scheme by 2025, and Japan is set to implement a levy on fossil fuel imports in 2028. Many other countries, such as Australia, Canada, South Korea, and India, are considering or have expressed interest in CBAM-like instruments. U.S. policymakers have brought forward their own approaches in drafting legislation before the Senate and in policy proposals from the Biden administration.
The next challenge is to leverage trade tools to accelerate the development and deployment of clean technologies that support developing countries’ transition to industrialized, low-carbon economies. Figure 2 showcases developing regions’* projected 2050 emissions (excluding developing nations in the European Union) for a BAU scenario.
Figure 2. Visualizing mid-century emissions for a BAU for Developing Regions (GT)
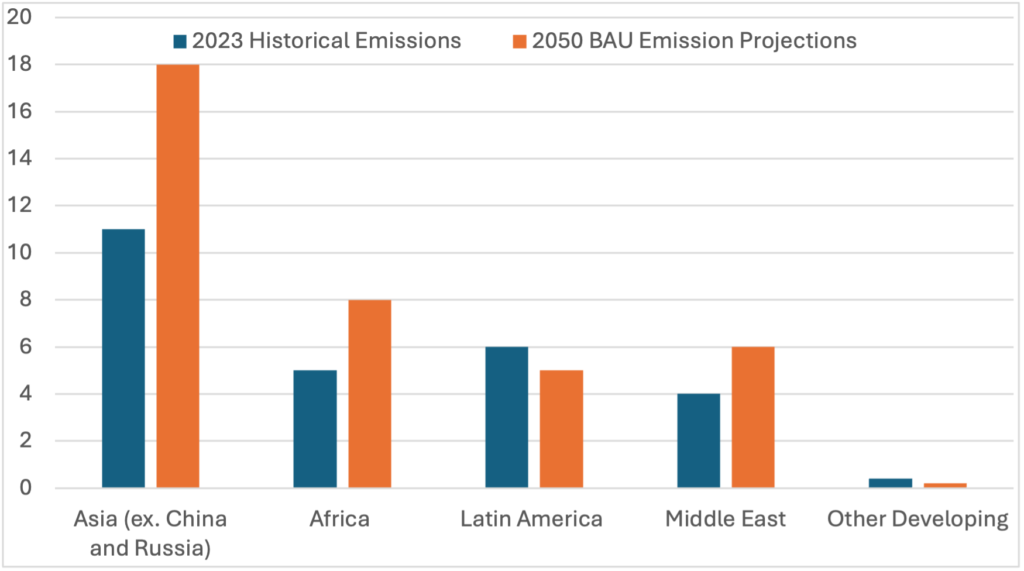
*Developing countries are aggregated per region.
Data from: World Emissions Clock, calculation by the author;
Regions with the highest growth rates—specifically Asia and Africa—could be prime targets for first using these tools, potentially mitigating some of the projected emissions. Asia, excluding China and Russia, is projected to be the highest overall emitter, hitting 20 GT in 2050—increasing by 63% from 2023 levels. Africa’s emissions are projected to increase by 60%, reaching 8 GT in 2050, followed by the Middle East, Latin America, and other developing countries (primarily the Caribbean and Oceania Island States).
Top emitting regions also have some of the highest rates of extreme poverty, creating a moral imperative for advanced economies to support the Global South’s development along a low-carbon pathway. These countries should not be expected to prioritize climate mitigation over basic needs and economic development. However, their energy choices will significantly impact global emissions. Trade tools can support both development and decarbonization by strengthening North-South economic ties and making clean energy technologies and investment more readily available to developing markets. Leveraging trade to assist the Global South in industrial decarbonization can create a race-to-the-top environment—closing the carbon loophole and ensuring a more equitable energy transition.