In the complex landscape of international trade and climate policy, the question of carbon efficiency—how much carbon dioxide is emitted in the production of goods—has become increasingly important. The Climate Leadership Council’s newly released report, America’s Carbon Advantage 2025, offers a comprehensive analysis of the carbon intensity of various industrial sectors. The findings are clear: the U.S. maintains a strong carbon efficiency advantage.

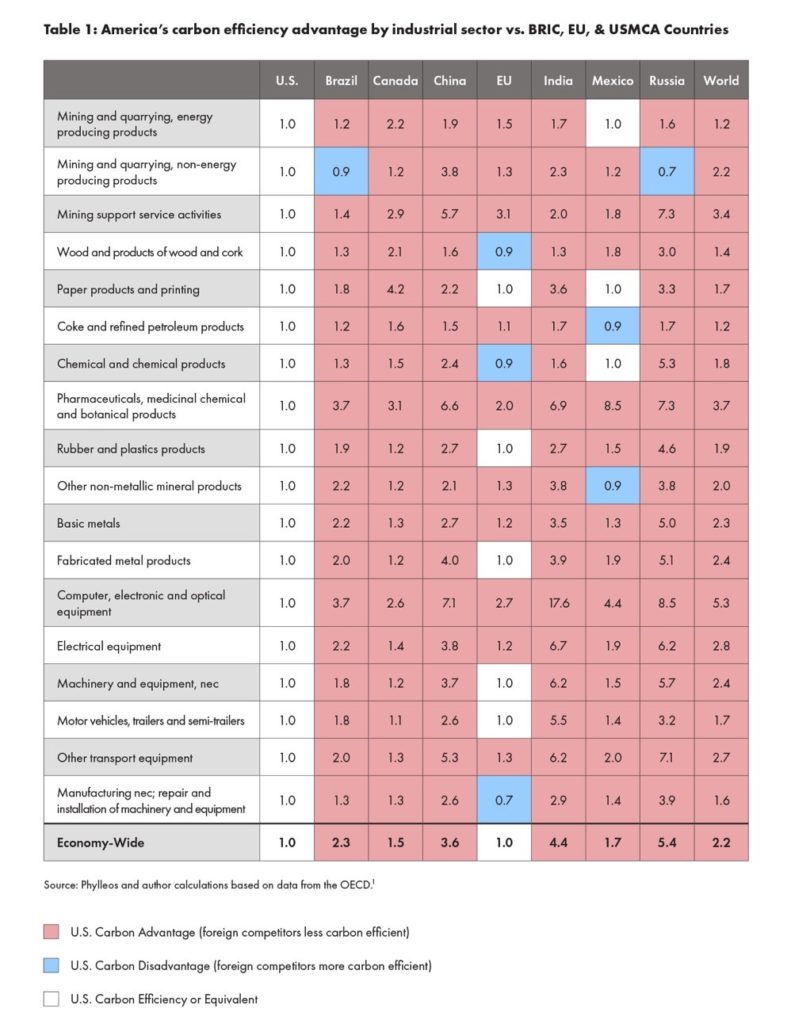
The data in Table 1, which compares the carbon efficiency of U.S. firms against major trading partners, offers valuable insights on the U.S. carbon advantage. At a high level, the table evaluates the carbon intensity of various manufacturing sectors and provides an economy-wide value for each country. The data is broken down into three main categories:
- Red values (greater than 1.0) indicate sectors where the U.S. produces the same value of products with fewer emissions than competing economies, highlighting a clear carbon advantage.
- Blue values (less than 1.0) indicate sectors where the U.S. is less carbon-efficient than other countries, meaning that competitors can produce the same value of goods with fewer emissions.
- White values (equal to 1.0) indicate areas where the U.S. and its trading partners are equally carbon-efficient.
This table showcases that the U.S. is more carbon-efficient than most major trading partners at the economy-wide level. The closest comparisons are the EU, Canada, and Mexico, with the U.S. outperforming them by producing goods with 50%–70% fewer emissions. On the other hand, the BRIC countries (particularly China) are less carbon-efficient, requiring two to five times more emissions to produce the same value of goods. Overall, the U.S. is more carbon-efficient than the global average, using only 45% of the emissions required by the rest of the world to generate the same dollar of value.
A crucial aspect to consider is that the data presented in Table 1 includes broad economic sectors and full supply chain emissions. Diverse activities are condensed into single sectors like “chemicals and chemical products,” which offers clearer comparisons between countries. In addition, the data accounts for full supply chain emissions, and variations in carbon intensity often expand along the supply chain itself. Since the U.S. produces primary industrial goods with fewer emissions, this allows for more carbon-efficient intermediate goods and final products as well.
The U.S. carbon advantage has far-reaching implications for policymaking, especially as countries look for ways to ramp up manufacturing and reduce emissions. One of the most important applications of this data is in the development of carbon border adjustment mechanisms (CBAMs). Countries that make up more than 60% of the global market are exploring these border measures, and a range of discussions and proposals indicate interest here at home. To remain competitive in the global market and navigate international CBAMs, the U.S. will need accurate and comprehensive carbon efficiency data.
With this in mind, policymakers in the U.S. have introduced the Providing Reliable, Objective, Verifiable Emissions Intensity and Transparency (PROVE IT) Act, which aims to assess the carbon intensity of imported goods. Legislation like the PROVE IT Act would reinforce America’s carbon advantage by providing verifiable, high-quality data across dozens of industries. While such detailed emissions data isn’t a requirement for implementing a CBAM in the U.S., it forms a valuable foundation.
Ultimately, the data underscores a crucial takeaway: when it comes to global emissions, where something is made matters. Countries that dominate production in energy-intensive industries will shape the trajectory of global emissions. Leveraging the U.S.’s carbon efficiency to inform trade policy, regulatory decisions, and global partnerships could help reduce emissions on a global scale while bolstering economic competitiveness.
