
Where and how goods are made has a huge impact on how much carbon dioxide is released into the atmosphere during their manufacture. Most climate policies around the world have focused on each country reducing the emissions produced within its borders. But the emissions that were released in other countries to produce the goods and services we consume at home are just as important, as far as the climate is concerned.
In 2018, the United States imported 1.4 billion metric tons of CO2 as so-called embodied emissions. These emissions were released during the manufacture of goods and services produced overseas and consumed here at home. Though they were generated outside the U.S., they represented about a quarter of the aggregate emissions released to satisfy all U.S. consumption that year.
Where do these imported emissions come from? The table below shows the top ten industry categories from which the U.S. imported significant embodied CO2 emissions in 2018.
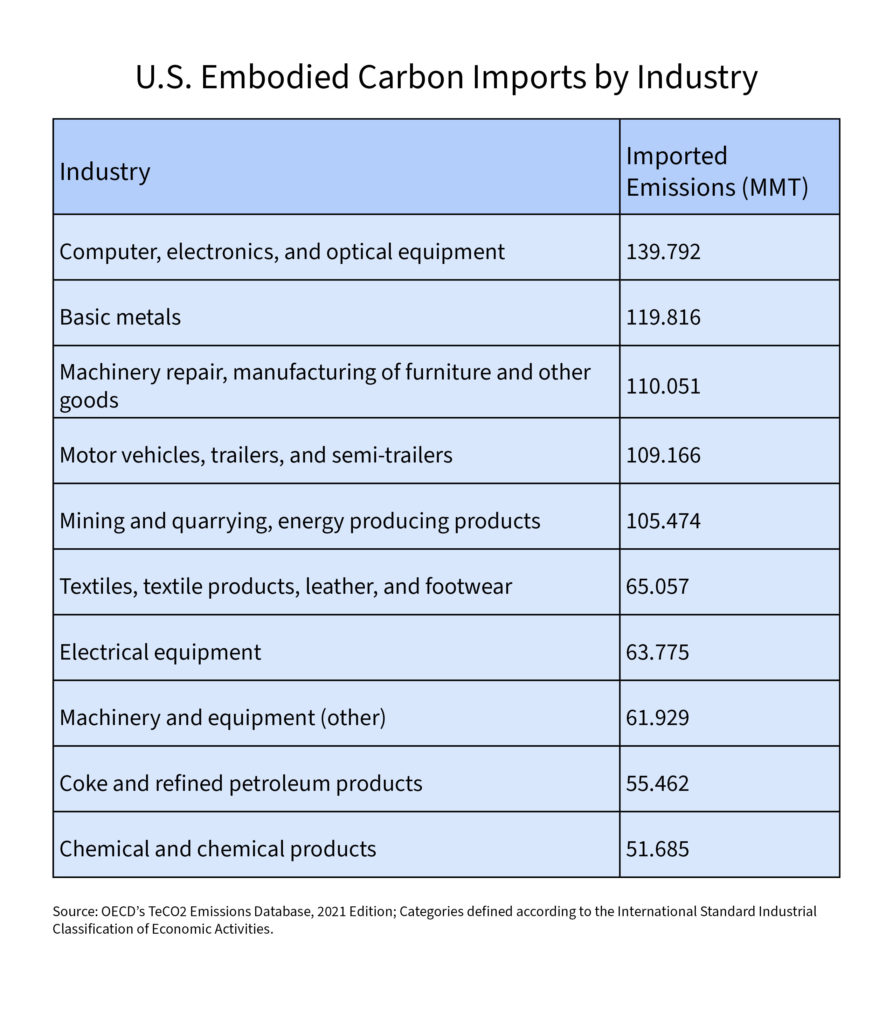
Some of these sources of emissions are energy-intensive sectors like metals, coal, petroleum, and chemicals—or major industrial products like machinery, cars and trucks.
Other categories are not obvious major sources of carbon emissions. Take computers, electronics, and optical equipment. These products are highly engineered and rely on a large amount of intellectual and human capital. But they are also made of different metals and glass that require a lot of energy to refine, manufacture, and assemble.
Likewise, motor vehicles and umbrella categories such as machinery repair, manufacturing of furniture and other goods use lots of heavy industrial material as inputs. Note also that the large amount of traded carbon embodied in these sectors is undoubtedly due to the high degree of aggregation in these data categories (an artifact of the underlying reported data, which is based on an international standard for classifying economic activities).
Another less obvious source of imported emissions comes from textiles, leather, and shoes. Lower labor costs and other market dynamics have pushed most production of these goods for U.S. consumption abroad. While not as carbon intensive as other categories, textiles still comprise a large share of imported emissions due to two factors: the scale of our textile imports ($164.2 billion in 2018) and the carbon-intensity of the economies that produce them.
Many of the countries that specialize in producing textile goods rely on carbon-intensive energy systems and, for synthetic fabrics, carbon-intensive inputs. For example, the U.S. imported 33.2 million tons of CO2 from Chinese textiles and 10.8 million tons from textiles made in India. Textile production in China and India is 83% and 127% more carbon-intensive per dollar of output, respectively, than U.S. textile production, according to calculations from the MacroDyn Group, an economic consultancy that supplied underlying data for the Climate Leadership Council’s America’s Carbon Advantage report.
U.S. producers across economic sectors have a decisive carbon efficiency advantage, especially against large global exporters. Reducing the emissions embodied in our imports will require a new frame for U.S. policy at the intersection of climate and trade. Knowing which imported goods are the largest sources of embodied emissions is an important first step.