
Import fees based on emissions intensity are just around the corner. The EU Carbon Border Adjustment Mechanism (CBAM) is in effect and on January 31, importers were required to submit their first CBAM reports on the emissions associated with production of iron and steel, aluminum, cement, fertilizers, hydrogen, and electricity. Beginning in 2026, importers will be required to pay a fee on these emissions. The cross-border reporting of emissions data, soon to be followed by corresponding import fees, marks a significant transition for the global trading system.
In part due to the U.S. carbon advantage in manufacturing of CBAM-covered goods, our projections show that the U.S. will pay less in total CBAM fees than most major economies (see Figure 1).
Figure 1. Projected annual CBAM costs based on recent trade flows and carbon intensity data.
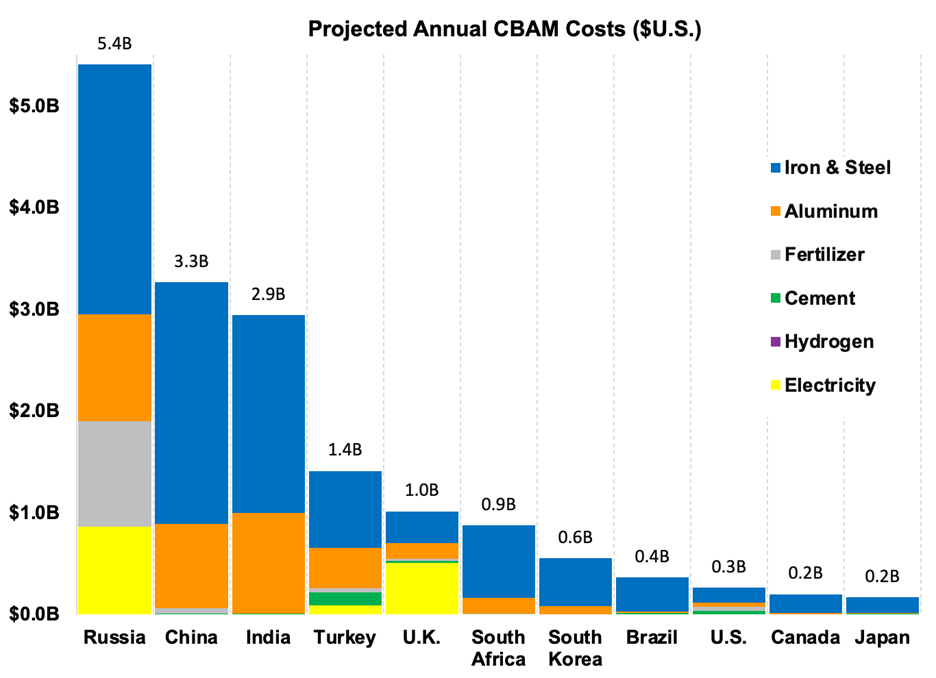
To calculate total CBAM costs, we multiplied each country’s value of exports to the EU (in U.S. dollars) for each CBAM-covered product by a country-and sector-specific emissions intensity factor. We then applied a projected CBAM charge of $120/ton of emissions.
Figure 1 expands on previous Council analysis to show that when we account for the carbon intensity of covered products and the value of U.S.-EU exports, the U.S. will experience a lighter CBAM burden than most major economies. The U.S. looks especially well-positioned in comparison to Russia, China, and India, who will pay the lion’s share of the CBAM dues.
Beyond total costs, an additional variable will play into how economies respond to these fees. Whether due to geographic proximity or trade relationships, an export economy’s degree of reliance on the EU market will dictate how exposed its industry is to CBAM price pressures (see Figure 2). Firms that export heavily to the EU can continue to compete for EU market share by decarbonizing their operations, or they can respond by diminishing their trade to the EU and seeking alternative export destinations for their carbon-intensive products.
Figure 2. Percentage of global CBAM-covered exports sent to the EU market.
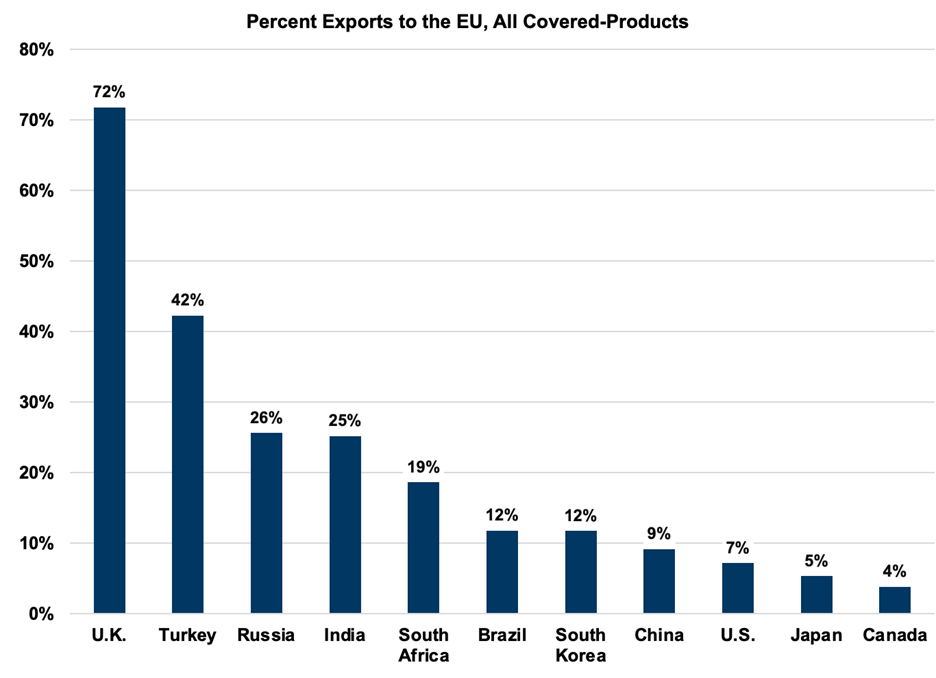
Compared to other major economies, the U.S. is not dependent on the EU market for its exports in CBAM-covered product categories. The U.S. sends just 7% of all its CBAM-covered global exports to the EU and is not overly reliant on the EU market in any one sector.
Take iron & steel, for example, which makes up over 60% of U.S. exports to the EU in CBAM-covered products. The U.S. sends less than 7% of its global iron & steel exports to the EU, with most U.S. iron & steel exports going to Canada and Mexico. Because of the U.S. carbon advantage in manufacturing of steel products, U.S. steel firms will pay less CBAM fee per product and have an opportunity to edge out foreign companies for increased EU market share.
To assess the true impact that CBAM costs will have to a particular sector, additional Council analysis uses a new metric that combines a country’s sector-specific CBAM costs with its level of EU market dependency. We call this a “relative CBAM cost burden.”
Relative CBAM Cost Burden = Total annual CBAM costs ÷ Total annual value of global exports in CBAM-covered products
By factoring in the value of a country’s global exports, this metric expresses the weight of the CBAM in relative rather than in gross terms (see Figure 3). Let’s take China and India, for example. Both countries are carbon-intensive manufacturers of CBAM-covered products, but they will experience these costs differently. Our calculations show that China will pay 15% more in total CBAM costs than India, in part because China exports 2x more CBAM-covered products to the EU than India. China, however, is a much larger exporting economy than India; China exports 7x more CBAM-covered products globally.
Even though China pays more in total CBAM dues, the relative cost burden metric shows that China is paying a smaller share of its global export revenue into the CBAM than India. China exports just 9% of its iron & steel and 12% of its aluminum to the EU, with most of its shipments destined for other countries in Southeast Asia. Despite its carbon-intensive production, China will experience a middle-tier relative cost burden since the value of Chinese global exports is high relative to its CBAM costs.
India, on the other hand, is set to experience a very high relative CBAM cost burden due to its carbon-intensive production and high degree of reliance on the EU market. India exports 25% of its iron & steel and aluminum to the EU market, which means that its CBAM costs will be high compared to the revenue that India generates from its global exports of CBAM-covered goods.
Firms from India and other countries that are exposed to a high relative cost burden will be more likely than competitors to feel the weight of the CBAM price, since these costs will stack up higher on their balance sheets. This increased price pressure will push companies to either decarbonize their operations to remain competitive in the EU market or seek alternative export destinations.
Figure 3. Projected annual CBAM costs, divided by the total value of country’s global exports in CBAM-covered products.
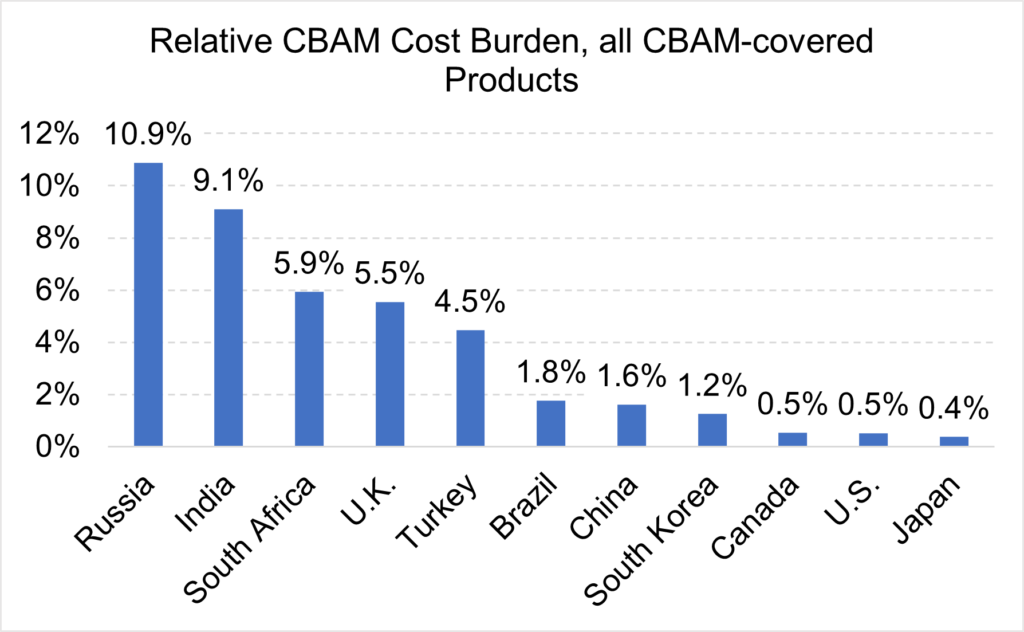
Compared to other major economies, the U.S. is set to experience a low relative CBAM cost burden. American firms will pay less in CBAM fees since they are more carbon-efficient than foreign competitors. They will also be less subjected to price pressures that will force foreign companies to decarbonize their operations or avert their exports to other markets, since U.S. firms are less reliant on the EU market as an export destination.
The U.S. relative CBAM cost burden is 3x less than China and Brazil, 10x less than Turkey, the U.K, and South Africa, and 20x less than India and Russia, who will experience the greatest relative cost burden These projections are consistent with findings by the Boston Consulting Group and the World Bank – U.S. firms will be less impacted by CBAM fees than foreign competitors and less exposed to the demands of the EU market.
The U.S. is positioned to benefit broadly from trade mechanisms like the CBAM that introduce accountability for the carbon intensity of industrial production.